Fluctuations in Population Densities
180 likes | 367 Vues
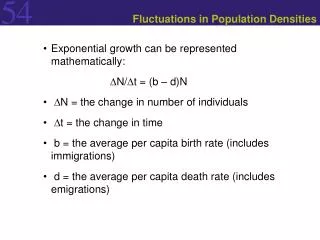
Fluctuations in Population Densities. Exponential growth can be represented mathematically: D N/ D t = (b – d)N D N = the change in number of individuals D t = the change in time b = the average per capita birth rate (includes immigrations)

Fluctuations in Population Densities
E N D
Presentation Transcript
Fluctuations in Population Densities • Exponential growth can be represented mathematically: DN/Dt = (b – d)N • DN = the change in number of individuals • Dt = the change in time • b = the average per capita birth rate (includes immigrations) • d = the average per capita death rate (includes emigrations)
Fluctuations in Population Densities • The difference between per capita birth rate (b) and per capita death rate (d) is the net reproductive rate (r). • When conditions are optimal, r is at its highest value (rmax), called the intrinsic rate of increase. • rmax is characteristic for a species. • The equation for population growth can be written D/Dt = rmaxN
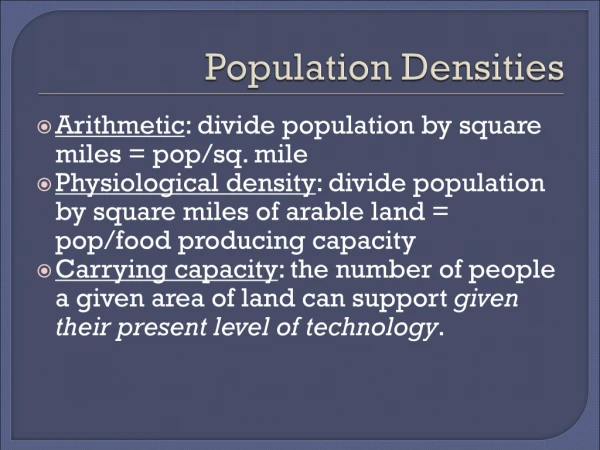
Fluctuations in Population Densities • Real populations do not grow exponentially for long because of environmental limitations. • Environmental limitations include food, nest sites, shelter, disease, and predation. • The carrying capacity of an environment (K) is the maximum number of individuals of a species it can support.
Fluctuations in Population Densities • The mathematical representation of this type of growth (logistic growth) is: DN/Dt = r[(K – N)/K]N • The equation for logistic growth indicates that the population’s growth slows as it approaches its carrying capacity (K). • Population growth stops when N = K.
Fluctuations in Population Densities • Per capita birth and death rates usually fluctuate in response to population density; that is, they are density-dependent. • Competition for resources • Easier for disease to spread. • Factors that affect birth and death rates in a population independent of its density are said to be density-independent. • For example, a severely cold winter may kill large numbers of a population regardless of its density.
Figure 54.9 Population Sizes May Be Stable or Highly Variable
Population Fluctuations • Densities of populations that depend on limited resources fluctuate more than those that use a greater variety of resources. • Why does this make sense?
Population Fluctuations • Predator–prey interactions generate fluctuations because predator population growth lags behind growth in prey and the two populations oscillate. • Lynx-Hare activity. • Experiments with Canada lynx and snowshoe hares revealed that the oscillating cycle of their populations was driven by both predation and food supply for the hares.
Figure 54.11 Hare and Lynx Populations Cycle in Nature (Part 1)
Managing Populations • A general principle of population dynamics is that the total number of births and the growth rates of individuals tend to be highest when a population is well below its carrying capacity. • If we wish to maximize the number of individuals that can be harvested from a population, that population should be managed so that its population is far below its carrying capacity. • Hunting seasons are established with this objective in mind.
Managing Populations • Populations with high reproductive capacities can sustain their growth despite a high rate of harvest. • Fish are an example of a population with high reproductive capacity. • High number of eggs produced by each.
Managing Populations • The whaling industry engaged in excessive harvests that almost caused the extinction of blue whales. • Management of whale populations is difficult because they reproduce at a low rate. • Since whales are distributed worldwide, their management is dependent on cooperative action by all whaling nations (which is difficult to achieve).
Managing Populations • To reduce the size of populations of undesirable species, removal of resources is more effective than large-scale killing. • By removing resources, the species will have a reduced carrying capacity and therefore lower numbers. • Killing large numbers of the species would simply reduce them to a population size that grows more rapidly to reach its carrying capacity. • Conversely, if a rare species is to be preserved, the most important step usually is to provide it with suitable habitat.
Managing Populations • Humans have introduced many species to new habitats outside their native ranges. • Rabbits in Austrailia • Opuntia cactus in Austrailia.
Managing Populations • For many thousands of years, Earth’s carrying capacity for humans was set at a low level by food and water supplies and by disease. • What caused the increase? • Medicine • Agriculture • Others • Earth’s carrying capacity is currently limited by: • “Waste” removal • Willingness to destroy other species.