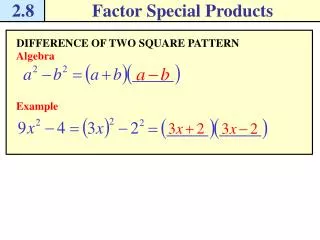
Download
1 / 47
510 likes | 896 Vues
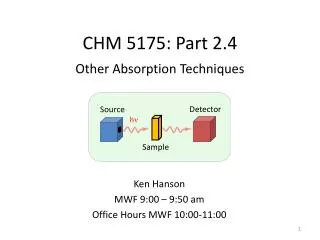
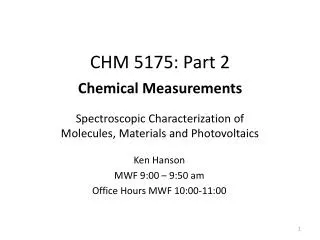
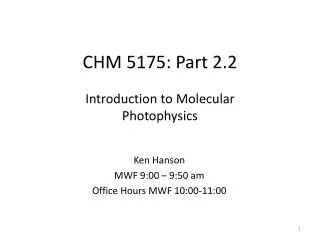
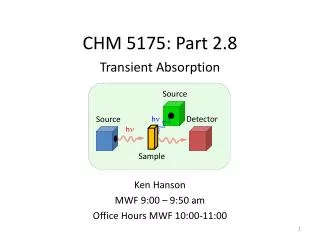
Transient Absorption. CHM 5175: Part 2.8. Source. Detector. Source. h n. Ken Hanson MWF 9:00 – 9:50 am Office Hours MWF 10:00-11:00. h n. Sample. Excited State Decay. Steady-state Emission Time-resolved Emission. Absorption Spectroscopy. NMR Mass-spec x-ray….

E N D
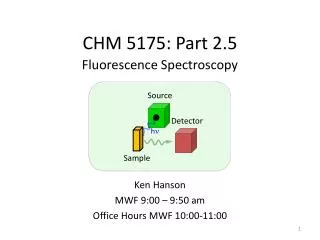
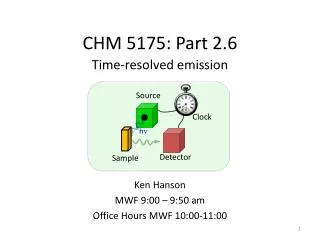
Transient Absorption CHM 5175: Part 2.8 Source Detector Source hn Ken Hanson MWF 9:00 – 9:50 am • Office Hours MWF 10:00-11:00 hn Sample
Excited State Decay Steady-state Emission Time-resolved Emission Absorption Spectroscopy NMR Mass-spec x-ray… Non-radiative Decay
Events in Time Photochemistry Isomerization Intersystem Crossing Excitation Fluorescence Phosphorescence InternalConversion pico femto nano micro seconds milli 1 s 1 fs 1 ps 1 ns 1 ms 1 ms 0.000 000 001 s 0.000001 s 0.001 s 1 s 0.000 000 000 001 s 0.000 000 000 000 001 s
Transient Absorption Spectroscopy Transient Absorption 1) High intensity pulse of light. 2) Monitor absorption spectrum over time. Excitation Internal Conversion Fluorescence Non-radiative decay Intersystem Crossing Phosphorescence Source S2 S1 Detector Source hn T2 hn E T1 Sample S0
Transient Absorption Spectroscopy TA of Photochromic Sunglasses (seconds to minutes) Steps 1) Excitation (sunlight) 2) Go inside 3) Monitor color change over time
Visual Spectroscopy “The human eye and its brain interface, the human visual system, can process 10 to 12 separate images per second (10 Hz), perceiving them individually.” 10 ms or 0.01 s 100 ms or 0.1 s Time Time Perceived as green and then red. Perceived as yellow.
We are missing out! 70 Hz 14 ms per cycle
Time-resolved Spectroscopy Eadweard Muybridge The Horse in Motion (1872)
Time-resolved Spectroscopy Muybridge was able to record events on the scale of about 0.001 second in 1877 1 ms time resolution!
Spectroscopy Timeline 150 years = 17 orders of magnitude 17 orders of magnitude (bacteria vs. size of the solar system)
Transient Absorption Spectroscopy Source Transient Absorption (Pump-Probe Experiment) 1) High intensity pulse of light. 2) Monitor absorption spectrum over time. Detector Source hn hn Sample
Transient Absorption Spectroscopy Electron Transfer Dynamics hn A A- A C C+ C*
Transient Absorption Spectroscopy Electron Transfer Dynamics A A- A C C+ C*
Transient Absorption Spectroscopy Excited State Absorption Spectra 1) Excitation (hnpump) 2) Absorption Spectra (hnprobe) C C*
Basics of TA Measurement (2) Events: 1) Absorption Spectra 2) Excitation Flash 3) Absorption spectra (3) (1) (1) (3) Excited State Source probe probe probe pump Ground State Detector Source hn hn Sample Time
Difference Spectra 4 excited states/100 molecules hn S1 E A for xS0 molecules A for (x - y)S0 + yS1 molecules S0
Difference Spectra A(t) - A(0) = DA A(0) = absorption without laser pulse A(t) = absorption at time t after laser pulse A(t) DA at time t A(0) - = A for xS0 A for (x - y)S0 + yS1 - yS0 + yS1
Difference Spectra ∝ S1 generated ∝ S0 lost We don’t get to measure absorbance!
P0 Difference Spectra We measure transmittance! Absorbance: A = -log T = log P0/P A(t) - A(0) = DA Sample P0(t) P0(0) P A(0) = log A(t) = log P(t) P(0) (power in) (power out) Probe source is the Same P0(t) = P0(0) P(0) = power out before pump P(t) = power out after pump P(0) Then: DA = log P(t)
TA Measurement (2) Events: 1) Measure P(0) 2) Pump 3) Measure P(t) (3) (1) (1) (3) Source P(0) = power out before pump P(t) = power out after pump P(0) DA = log P(t) Detector Source hn hn Sample
TA Measurement Single l detection Full spectra detection Pump Pump Detector Detector hn hn Probe Probe hn hn Sample Sample
Single Wavelength to Full Spectrum Full Spectrum Data Single Wavelength
Events in Time Photochemistry Isomerization Intersystem Crossing Excitation Fluorescence Phosphorescence InternalConversion pico femto nano micro seconds milli 1 s 1 fs 1 ps 1 ns 1 ms 1 ms Nanosecond TA Picosecond TA Femtosecond TA Attosecond TA
Nanosecond TA (10-9 s) First developed in the 1950s (Eigen, Norrish and Porter) 1967 Nobel Prize in Chemistry “for studies of extremely fast chemical reactions, effected by disturbing the equilibrium by means of very short impulses of energy” Source Detector Source hn hn Sample
Nanosecond TA (10-9 s) high-intensity photography lamp 1 m quartz tube Photomultiplier tube Tungsten lamp
Nanosecond TA (10-9 s) Xe Flash Lamp Q-switch laser Nd:YAG, Ar Ion <10 ns pulsewidth Mono- chrometer PMT
Commercial Nanosecond TA systems Hamamatsu-F157 Edinburgh-LP920 Ultrafast Systems-Proteus Applied Photophysics- LKS80
Picosecond TA (10-12 s) Or picosecond white-light continua Flash Lamp Mode-locked Laser
Femtosecond TA (10-15 s) First developed in the 1980s (A. H. Zawail) 1999 Nobel Prize in Chemistry “for his studies of the transition states of chemical reactions using femtosecond spectroscopy"
Femtosecond TA (10-15 s) (1) Pump (2) Probe Delay Stage (3) (4) 1) Femtosecond laser pulse 2) Beam splitter (into Pump and Probe) 3) Probe Travels through Delay Stage 4) Pumphits sample (exciation) 5) Probehits sample 6) Transmitted Probehits detector Detector
Femtosecond TA (10-15 s) DA = log P(0)/P(t) Pump Graph of t vsDA Transient Concentration DA Intensity time time blank P(0) pump probe Transmitted Light at time 1 P(t1) td1 Intensity P(t) time time Transmitted Light at time 1 P(t2) pump probe td2 Intensity Intensity time time
Femtosecond TA (10-15 s) DA = log P(0)/P(t) P(t) > P(0) P(t) < P(0) blank P(0) blank P(0) pump pump probe probe td1 td1 Intensity Intensity time time Increased Transmitted light P(t) Decrease Transmitted light P(t) P(t) P(t) time time Graph of t vsDA Graph of t vsDA DA DA time time New species after laser pulse. Loss of species after laser pulse.
Single Wavelength to Full Spectrum Full Spectrum Data Single Wavelength
Attosecond Spectroscopy (10-18 s) “However, the resolution offered by femtosecond spectroscopy is insufficient to track the dynamics of electronic motion in atoms or molecules since they evolve on an attosecond (1 as = 10−18 s) to few-fs time scale and thus remain elusive so far.” 6-fs pulse 300 attosecond pulse Nature Physics3, 381 - 387 (2007)
Nano-femtosecond TA Light Amplification by Stimulated Emission of Radiation
I I0 I1 I3 I2 Laser medium R = 100% R < 100% Nano-femtosecond TA Light Amplification by Stimulated Emission of Radiation Mode-Locking Lasers • Light Sources • Gain medium • Mirrors R. Trebino
Pico-femtosecond TA http://www.youtube.com/watch?v=efxFduO2Yl8
Attosecond TA a–d, An intense femtosecond near-infrared or visible (henceforth: optical) pulse (shown in yellow) extracts an electron wavepacket from an atom or molecule. For ionization in such a strong field (a), Newton's equations of motion give a relatively good description of the response of the electron. Initially, the electron is pulled away from the atom (a, b), but after the field reverses, the electron is driven back (c) where it can 'recollide' during a small fraction of the laser oscillation cycle (d). The parent ion sees an attosecond electron pulse. This electron can be used directly, or its kinetic energy, amplitude and phase can be converted to an optical pulse on recollision.
Attosecond TA Electronic excitation and relaxation processes in atoms, molecules and solids, and possible ways of tracing these dynamics in real time.
Attosecond Spectroscopy “However, the resolution offered by femtosecond spectroscopy is insufficient to track the dynamics of electronic motion in atoms or molecules since they evolve on an attosecond (1 as = 10−18 s) to few-fs time scale and thus remain elusive so far.” 6-fs pulse 300 attosecond pulse Nature Physics3, 381 - 387 (2007)
Transient Absorption End Any Questions?