CHM 5175: Part 2.3
920 likes | 1.34k Vues
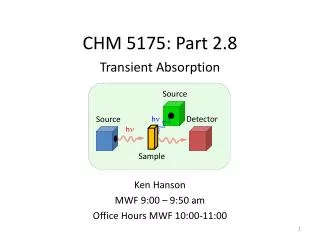
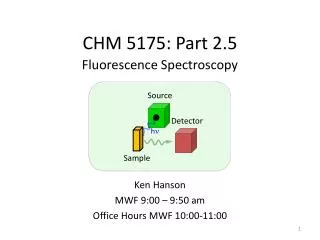
Detector. Source. h n. CHM 5175: Part 2.3. Sample. Absorption Spectroscopy. Ken Hanson MWF 9:00 – 9:50 am Office Hours MWF 10:00-11:00. Absorption Spectroscopy. Detector. Source. h n. Sample. Why Absorption Spectroscopy?. Detector. Source. h n. Color is ubiquitous to humans

CHM 5175: Part 2.3
E N D
Presentation Transcript
Detector Source hn CHM 5175: Part 2.3 Sample Absorption Spectroscopy Ken Hanson MWF 9:00 – 9:50 am • Office Hours MWF 10:00-11:00
Absorption Spectroscopy Detector Source hn Sample
Why Absorption Spectroscopy? Detector Source hn • Color is ubiquitous to humans • 1000 x more sensitive than NMR • Qualitative technique (what is in the solution) • Quantitative technique (concentrations, ratios, etc.) • Its easy • It is inexpensive • Numerous applications Sample
Absorption Spectroscopy in Action HPLC pKa Determination Yellow (pH > 4.4) Structure Differentiation Levopimaric acid Abietic Acid Red (pH > 3.2) 253 nm 214 nm
Examples Detector Source hn 3D Glasses Astrochemistry Sample Source Source Sample Detector Detector Sample First homework (not really): Think of examples of absorption spectroscopy
Outline • 1) Absorption • 2) Spectrum Beer's Law • 3) Instrument Components • Light sources • Monochrometers • Detectors • Other components • The sample • 4) Instrument Architectures • 5) UV-Vis in Action • 6) Potential Complications Detector Source hn Sample
P0 Absorption by the Numbers hn hn Sample We don’t measure absorbance. We measure transmittance. Sample • Transmittance: • T = P/P0 P • Absorbance: • A = -log T = log P0/P (power in) (power out)
P0 Beer’s Law The Beer-Lambert Law (l specific): A = e c l Sample • A = absorbance (unitless, A = log10 P0/P) • e = molar absorptivity (L mol-1 cm-1) • l = path length of the sample (cm) • c = concentration (mol/L or M) P (power in) (power out) l in cm Concentration Absorbance Path length Absorbance Molar Abs. Absorbance
Absorption Spectrum Alexandrite Gemstone BeAl2O4 (+ Cr3+ doping) Sunlight Candle/ Incandescent
Beer’s Law The Beer-Lambert Law: • A = absorbance (unitless, A = log10 P0/P) • e = molar absorbtivity(L mol-1 cm-1) • l = path length of the sample (cm) • c = concentration (mol/L or M) A = e c l Find e Make a solution of know concentration (C) Put in a cell of known length (l) Measure A by UV-Vis Calculate e A = ecl y = mx + b Find Concentrations Know e Put sample in a cell of known length (l) Measure A by UV-Vis Calculate C A = e c l
Beer’s Law Applied to Mixtures N719 RuP2 A1 = e1 c1 l Atotal = A1 + A2 + A3… Atotal = e1 c1 l + e2 c2 l + e3 c3 l Atotal = l(e1 c1 + e2 c2 + e3 c3)
Limitations to Bear’s Law The Beer-Lambert Law: • Reflection/Scattering • - Air bubbles • - Aggregates • Lamp effects • - Temperature (line broadening) • Light source changes • Solvent lensing • Absorbance too high (above 2) • Local environment effects • Dimerization • Refractive index change (ionic strength) • Sample changes • Photoreaction/decomposition • Side of the cuvette • Hydrogen bonding • Non-uniform through length A = e c l Reflection/Scattering Loss A = -log T = log P0/P
Absorption Spectroscopy Detector Source ? ? hn Sample Procedure Step 1: Prepare a sample Step 2: ??? Step 3: Obtain spectra (Profit!)
Instrumentation Full spectra detection Single l detection Detector Detector Source Source hn hn Sample Sample Sample Source hn
Instrumentation Detector Source hn Full spectra detection Single l detection Sample • Source • Sample • Monochrometer • Area detector • Source • Monochrometer • Sample • “Point” detector Light sources Monochrometer Detectors Samples
Light Sources, Ideal Experimentally we would like ~200 – 900 nm Ideal Light Source Detector Source hn Sample
Light Sources: The Sun Pros: It’s free! Does not die Relatively uniform from 400-800 nm Cons: Inconsistent Minimal UV-light Intense absorption lines Detector hn Sample
Light Sources: Xe Lamp Pros: Mimics the sun (solar simulator) It’s simple Cons: Relatively Expensive Minimal UV-light (<300 nm) Potential Instability Electricity through Xe gas
Light Sources: Tungsten Halogen Lamp Pros: Compact size High intensity Low cost Long lifetime Fast turn on Stable Cons: Very hot Bulb can explode Minimal UV-light (<300 nm) Halogen gas and the tungsten filament Higher pressure (7-8 ATM)
“White” Light Deuterium lamp + • Tungsten lamp – >300 nm • Deuterium lamp –200-330
Separating the Light Prism Source Grating hn Sample
Monochromator: Prism n0 is constant s is constant nprism is l dependent Wavelength Deviation • n0 = refractive index of air • nprism = refractive index of prism • = prism apex angle • d = deviation angle Monocromatic Light White Light Prism Slit
Monochromator: Grating d is constant θi is constant θr is l dependent Wavelength Diffraction Grating λ = 2d(sin θi + sin θr) λ = wavelength d = grating spacing θi= incident angle θr = diffracted angle White Light Monocromatic Light Slit
Monochromator: Grating Source Grating Mirrors Slits
Detectors • high sensitivity • high signal/noise • constant response for λs • fast response time Detector hn electrical signal Single l detection Full spectra detection CCD Diode Array PMT Diode
Detectors: Diode Forward Bias: Apply a positive potential holes + e- = exciton = light Light Emitting Diode Zero Bias: Apply 0 potential exciton = holes + e- = current silicon solar cell Negative Bias: Apply a negative potential exciton = holes + e- = more current photodetector n-type (extra electrons)- P or As doped p-type (extra holes)- Al or B doped
Detectors: Diode Pros: Long Lifetime Small/Compact Inexpensive Linear response 190-1000 nm Cons: No wavelength discrimination Minimal internal gain Much lower sensitivity Small active area Slow (>50 ns) Low dynamic range 0.025 mm wide
Detectors: PMT • Cathode: 1 photon = 5-20 electrons • More positive potential with each dynode • Operated at -1000 to -2000 V
Detectors: PMT Photocathodes Architectures Circular Cage Linear
Detectors: PMT Pros: Extremely sensitive UV-Vis-nIR 100,000,000x current amplifier (single photons) Low Noise Compact Inexpensive ($175-500) Cons: No wavelength discrimination Wavelength dependent t Saturation Magnetic Field Effects
Detectors: PMT Super-Kamiokande Experiment • 1 km underground • h = 40 m, d = 40 m • 50,000 tons of water • 11,000 PMTs • neutrino + water = Cherenkov Radiation
Instrumentation Single l detection Detector Detector Source Detector hn Source hn Sample Sample Full spectra detection Sample Source hn
Full Spectrum Detection Detector Diode Array CCD Source hn Sample
Detectors: Diode Array Diode Pros: Quick measurement Full spectra in “real time” Inexpensive Less moving parts Cons: Lower resolution (~1 nm) Slow (>50 ns) More expensive than a single l Diode Array Source hn Sample
Detectors: Charge-Coupled Device Source hn Sample
Detectors: CCD Pros: Fast Efficient (~80 % quantum yield) Full visible spectrum Wins you the 2006 Nobel Prize (Smith and Boyle) Cons: Lower dynamic range Fast (<50 ns) Gaps between pixels Expensive (~$10,000-20,000)
Area Detector Calibration Detector 650 nm Source Source Source Detector Offset Detector To Close hn hn hn Red? Blue? Green? Red? Blue? Green? Sample Sample Sample
Area Detector Calibration Detector Photocurrent Hg Lamp hn Length/Area Detector Hg Lamp Spectrum 365 nm 546 nm 436 nm Calibrated Detector
Instrumentation Single l detection Detector Detector Source Detector hn Source hn Sample Sample Full spectra detection Sample Source hn
Other Components Chopper Entrance/Exit Slits Mirrors Lenses Shutter
Other Components Polarizer Beam Splitter
Side Note: Pub Highlight DOI: 10.1021/ja406020r
Side Note: Pub Highlight DOI: 10.1021/ja406020r
Side Note: Pub Highlight Hemoglobin Absorption Biological Tissue Window Pig Lard Absorption
Side Note: Pub Highlight Plasmonic Heating Biological Tissue Window Photo Drug Delivery
THE SAMPLE Detector Source hn Solids Solutions Sample
The Sample: Cuvette for Solutions Glass Quartz Plastic Typically 1 x 1 cm A = e c l