Download

1 / 14
140 likes | 268 Vues
Chapter 18 delves into the concept of cross elasticity of demand, assessing how the quantity demanded of one product responds to price changes of another. It categorizes goods as substitutes, complements, or independent, and provides practical examples, such as how an increase in Coke's price leads to a rise in Pepsi sales. Additionally, it covers income elasticity of demand, differentiating between normal and inferior goods based on consumer income responses. This chapter also highlights the implications for government regulation concerning mergers and market efficiency.

E N D
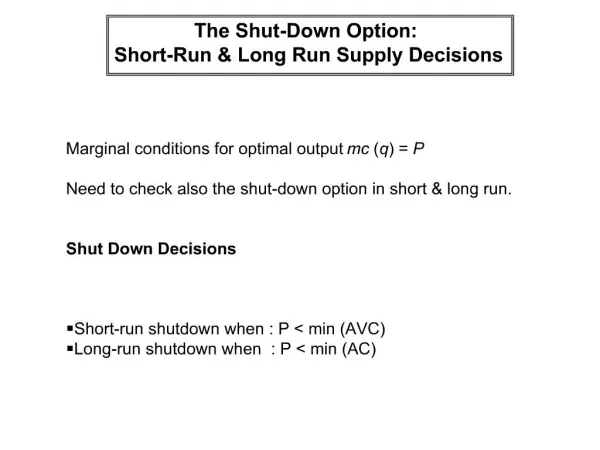
Short Run, Long Run and Efficiency Micro Chapter 18
Cross Elasticity of Demand • Measures how sensitive consumer purchases of one product are to a change in price of another product • Exy = Percentage change in Q demanded x/ Percentage change in price of Y
Substitute Goods • If Cross elasticity is > 0, x and Y are substitutes • Ex- price of Coke goes up, more Pepsi is purchased
Complements • Cross elasticity < 0, X and Y are complements • An increase in the price of X causes a decrease in the demand for Y • Ex- increase in the price of digital cameras leads to a decrease in the demand of memory cards
Independent Goods • Zero or near zero cross elasticity means the items are unrelated • Ex- walnuts and plums
Uses of Cross-Elasticity • Government uses cross elasticity when deciding whether mergers will violate anti-trust laws
Income Elasticity of Demand • Ei = % change in quantity demanded/ % change in income • Measures the degree to which consumers respond to a change in income in buying more or less of a particular good
Normal (Superior) Good • Ei > 0 • More demand as income increases • Ex- cars, vacation, electronics
Inferior Goods • Ei < 0 • Consumers decrease their purchases of inferior goods as income goes up • Ex- Ramen Noodles, retread tires
Consumer Surplus • The difference between the amount consumer(s) are willing to pay and equil $ Consumer Surplus Equilibrium Price = $8
Producer Surplus • Difference between the actual price a producer receives and the min. acc. price S Equilibrium Price = $8 P1 Price (Per Bag) Producer Surplus Q1
Efficiency S Consumer Surplus Equilibrium Price = $8 P1 Price (Per Bag) Producer Surplus D Q1 Quantity (Bags)
Efficiency/Deadweight Loss • Reductions of combined consumer and producer surpluses associated with underproduction or overproduction • Quantities < or > Q1
Efficiency Loss S Efficiency Losses P1 Price (Per Bag) D Q3 Q2 Q1 Quantity (Bags)