Download
1 / 27
270 likes | 458 Vues
TYPHOON COMMITTEE Integrated Workshop on Urban Flood Risk Management in a Changing Climate: Sustainable and Adaptation Challenges Macao, China 06-10 September 2010. Quantitative Precipitation Estimation (QPE) and Quantitative Precipitation Forecasting (QPF) of Japan Meteorological Agency.

E N D
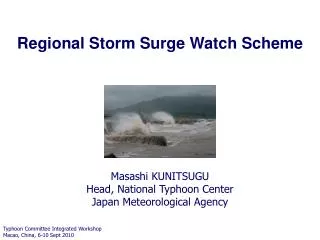
TYPHOON COMMITTEE Integrated Workshop on Urban Flood Risk Management in a Changing Climate: Sustainable and Adaptation Challenges Macao, China 06-10 September 2010 Quantitative Precipitation Estimation (QPE) and Quantitative Precipitation Forecasting (QPF) of Japan Meteorological Agency Masashi KUNITSUGUHead, National Typhoon Center Japan Meteorological Agency
Weather disasters in Japan Prologue Flood and Landslide
Torrential rain during BAIU, example of 21st July 2009 × Landslide 0100km 6hr 24hr Oneday precipitation (21st July 2009) 275.0 mm at Houfu city Hourly and total precipitation
Landslide 14 people were killed at Houfu City by debris flow (21st July 2009)
0100km 6hr 24hr Torrential rain around tropical depression, example of 9th Aug 2009 Oneday precipitation (9th Aug 2009) 326.5 mm Flood 326.5 mm Hourly and total precipitation 5
6hr Water level Flood 20 people were killed by flood ( 9th Aug 2009) Water Level (m) Flood water level
Heavy rain in a small area → Disaster How to estimate the possibility of disaster? Consecutive automatic system Step 1. Observation of precipitation (Radar, Surface) Step 2. Analysis and forecast of precipitation Step 3. Hydrological index (Soil water index and runoff index) input input 25 min. Warning ? or not?
Heavy rain in a small area → Disaster How to estimate the possibility of disaster? Consecutive automatic system Step 1. Observation of precipitation (Radar, Surface) Step 2. Analysis and forecast of precipitation Step 3. Hydrological index (Soil water index and runoff index) input input 25 min. Warning ? or not?
0 200 400 km Observation Networks Rain Gauge (Automatic Weather Station) 1,300: JMA 5,500: Local Governments 3,200: River Bureau
Observation Networks 0 200 400 km Radars 16: Doppler radars 4: Conventional radars 26: Radars (River Bureau) “One Composite Radar Chart”
Heavy rain in a small area → Disaster How to estimate the possibility of disaster? Consecutive automatic system Step 1. Observation of precipitation (Radar, Surface) Step 2. Analysis and forecast of precipitation Step 3. Hydrological index (Soil water index and runoff index) input input 25 min. Warning ? or not?
0 200 400 km Precipitation Analysis Rain gauges 1-hr precipitation Every 30min. 1km×1km resolution 20min. after obs. Weather Radars Not Radar-Echo but Analyzed Precipitation
Precipitation Analysis 天草 熊本県 . 30 八代海 2003.7.20.5 鹿児島県 Precipitation 0 40km 0 40km Rain gauge data Max 73 mm Precipitation Analysis calibrated radar data Analysis 1-hr precipitation 2003.7.21 05JST Radar data Rain-gauge Max 30 mm
Precipitation Forecast - Very Short Range Forecast (VSRF) 0100km • Q: What is VSRF? • A: • Quantitative precipitation forecast using radar-echo extrapolation and meso-scale NWP (MSM) GPV. • [Notes] • Issued every 30min up to 6 hours ahead • The longer the forecast time, the higher the weight of NWP(Changing merging weight every forecast time) • Orographic effect of precipitation (Seeder-feeder model) considered The threat score (CSI) of VSRF for Sept 2008 (Over 10mm/400km2, only land area)
0100km 0100km Comparison of observation and VSRF Compare the VSRF with the same time observation Observation VSRF
Heavy rain in a small area → Disaster How to estimate the possibility of disaster? Consecutive automatic system Step 1. Observation of precipitation (Radar, Surface) Step 2. Analysis and forecast of precipitation Step 3. Hydrological index (runoff index and Soil water index) input input 25 min. Warning ? or not?
Precipitation Runoff Index Water Level Time Precipitation Outflow to the river Travel down the river Runoff Index Every 5km along the river Flood potential: Runoff Index Precipitation 2007年9月7日0時 2007年9月7日6時 2007年9月7日12時 2007年9月7日6時 2007年9月7日12時 2007年9月7日0時 Runoff Index
observation 0100km Potential of Sediment Disaster: Soil Water Index water flow in soil forecast Storage Surface runoff Shallow runoff Permeation Groundwater runoff “Soil Water Index” is equivalent to the total storage volume of threeserial tanks Soil Water Index Precipitation Tank model First tank Surface runoff Storage Permeation Second tank Total Storage Storage Shallow runoff Permeation Third tank Storage Groundwater runoff Permeation
Hokkaido Hokkaido Sapporo Sapporo Tohoku Tohoku Hokuriku Hokuriku Sendai Sendai Niigata Niigata Kinki Kinki Chugoku Chugoku Osaka Osaka Hiroshima Hiroshima Kanto/Koshin Kanto/Koshin Tokyo Tokyo /headquarters /headquarters Fukuoka Fukuoka Northern Kyushu Northern Kyushu National Forecast Center National Forecasting Center Nagoya Nagoya Tokai Tokai Takamatsu Takamatsu Shikoku Shikoku Kagoshima Kagoshima Southern Kyushu Southern Kyushu Red : Area of responsibility (colored) Red: Area of responsibility (colored) Blue: Regional forecast center Blue : Regional forecast center Okinawa Okinawa Naha Naha JMA’s structure for operational forecast, advisory/warning National Forecast Center: (1, Tokyo) Regional Forecast Centers: (11) Local Meteorological Observatories: (56) LMO is responsible for issuing forecast, advisory and warning. Let’s see an example of Fukushima pref. Fukushima
Target area of Forecast and Warning (Fukushima pref.) Fukushima L.M.O 0100km Forecast and Warning zone Japan China Aizu Hamadori Nakadori As from May 2010, Warnings/Advisories are issued for each municipalities (cities) Target Warning Zones (374) ⇒ Cities (about 1,800)
Target area of Forecast and Warning (Fukushima pref.) Fukushima L.M.O 0100km 0100km Forecast and Warning zone Japan China Aizu Hamadori Nakadori 45municipalities As from May 2010, Warnings/Advisories are issued for each municipalities (cities) Target Warning Zones (374) ⇒ Cities (about 1,800)
Heavy rain in a small area → Disaster How to estimate the possibility of disaster? Consecutive automatic system Step 1. Observation of precipitation (Radar, Surface) Step 2. Analysis and forecast of precipitation Step 3. Hydrological index (runoff index and Soil water index) input input 25 min. Warning ? or not?
New system to assist forecasters 0 40km Improvement of Forecaster-aid System control of 5km mesh precipitation distribution comparison to warning criteria for respective cities Forecaster controls distribution (5km resolution) and sequence of precipitation usingforecaster-aid system. 5km×5km The system proposes warning/advisory cities and towns to forecasters. Warning Advisory
Summary (diagram of various products) Rain gauges Soil Water Index Analysis VSRF RADAR NWP Runoff Index Composit map ECHO Intensity ECHO Intensity HazardousWind potential Lightning Nowcast ECHO top ECHO top
Key Items for future development rainfall distribution forecast (up to 24 hours, in particular up to 3 hours) • Numerical model (NWP) • Local Forecast Model 2km, run every hour, up to 9 hours, 3D-Var • Meso-scale ensemble forecast system 10km, 5 members Very Short Range Forecast (VSRF) Radar data (10min → 5min) Improving process of growth and decay of rainfall area • Advanced man-machine interactive system & technique • Research of heavy-rainfall mechanism • Forecaster-friendly interface to support forecaster’s considerationproviding information using various new technologies