Download
1 / 31
480 likes | 1.24k Vues
The Trade-off Between Risk and Return. Chapter 6. The Trade-off Between Risk and Return. The Trade-off Between Risk and Return. The return earned on investments represents the marginal benefit of investing. Risk represents the marginal cost of investing.

E N D
The Trade-off Between Risk and Return Chapter 6
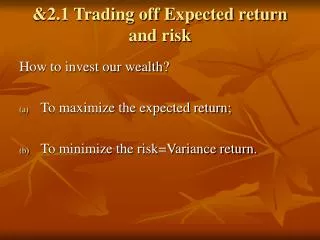
The Trade-off Between Risk and Return The return earned on investments represents the marginal benefit of investing. Risk represents the marginal cost of investing. A trade-off always arises between expected risk and expected return.
The Trade-off Between Risk and Return Valuing risky assets is a task fundamental to financial management Three-step procedure for valuing a risky asset 1. Determine the asset’s expected cash flows 2. Choose discount rate that reflects asset’s risk 3. Calculate present value (PV cash inflows - PV outflows) This three-step procedure is called discounted cash flow (DCF) analysis.
Components of the total return Income stream from the investment Capital gain or loss due to changes in asset prices Understanding Returns Total return: the total gain or loss experienced on an investment over a given period of time Total return can be expressed either in dollar terms or in percentage terms.
Total dollar return = income + capital gain or loss Terrell bought 100 shares of Micro-Orb stock for $25 A year later: Dividend = $1/share Sold for $30/share Dollar return = (100 shares) x ($1 + $5) = $600 Owen bought 50 shares of Garcia Inc. stock for $15 A year later: No dividends paid Sold for $25/share Dollar return = (150 shares) x ($15) = $500 Dollar Returns
Percentage Returns Terrell’s dollar return exceeded Owen’s by $100. Can we say that Terrell was better off? No, because Terrell and Owen’s initial investments were different: Terrell spent $2,500 in initial investment, while Owen spent $750.
Percentage Returns In percentage terms, Owen’s investment performed better than Terrell’sdid.
The History of Returns: Nominal ReturnsThe Value of $1 Invested in Stocks, Treasury Bonds, and Bills
The History of Returns: Real ReturnsThe Real Value of $1 Invested in Stocks, Treasury Bonds, and Bills
Percentage Returns on Bills, Bonds, and Stocks, 1900 - 2006 The Risk Dimension Risk premium: the additional return that an investment must offer, relative to some alternative, because it is more risky than the alternative.
Percentage Returns on Stocks, Treasury Bonds and Bills, 1900 - 2006
Table 6.2 Risk Premiums for Stocks, Bonds, and Bills, 1900–2006
Average Returns and Standard Deviation for Equities, Bonds, and Bills, 1900 - 2006 Volatility and Risk • Average return on stocks is more than double the average return on bonds, but stocks are 2.5 times more volatile. • Asset classes with greater volatility pay higher average returns.
The Distribution of Historical Stock Returns1900 - 2006 We can approximate the unknown probability distribution for future stock returns by assuming a normal distribution.
The Variability of Stock Returns • Normal distribution can be described by its mean and its variance. • Variance (2) – a measure of volatility in units of percent squared • Standard deviation – a measure of volatility in percentage terms
Table 6.3 Estimating the Variance of Stock Returns from 1994–2006
Table 6.4 Average Returns and Standard Deviation for Equities, Bonds, and Bills, (1900–2006)
Fig. 6.6 The Relationship Between Average (Nominal) Return and Standard Deviation for Stocks, Treasury Bonds, and Bills, 1900 - 2006 • Investors who want higher returns have to take more risk. • The incremental reward from accepting more risk is constant.
The Power of DiversificationAverage Returns and Standard Deviations for 11 Stocks, 1994-2006 From 1994 – 2006, the standard deviation of the typical stock in the U.S. was abut 60% per year, while the standard deviation of the entire stock market was only 19.8%!
The Power of Diversification Most individual stock prices show higher volatility than the price volatility of a portfolio of all common stocks. How can the standard deviation for individual stocks be higher than the standard deviation of the portfolio? Diversification: The act of investing in many different assets rather than just a few, so as to reducevolatility. The ups and downs of individual stocks partially cancel each other out.
Annual Returns on Coca-Cola and Wendy’s International • The two stocks did not always move in sync. • The net effect is that the portfolio is less volatile than either stock held in isolation.
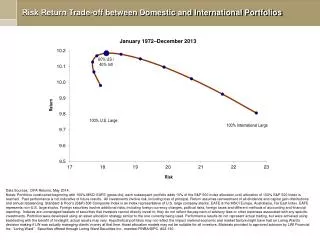
Average Returns and Standard Deviations of Portfolios of Stocks and Bonds, 1972 - 2006
The Relationship Between Portfolio Standard Deviation and the Number of Stocks in the Portfolio • The risk that diversification eliminates is called unsystematic risk. • The risk that remains, even in a diversified portfolio, is called systematic risk.
Systematic and Unsystematic Risk Diversification reduces portfolio volatility, but only up to a point. Portfolio of all stocks still has a volatility of 19.8%. Systematic risk: the volatility of the portfolio that cannot be eliminated through diversification. Unsystematic risk: the proportion of risk of individual assets that can be eliminated through diversification What really matters is systematic risk…. how a group of assets move together.
Does this trade-off hold for individual securities? Risk and Return Revisited • For the various asset classes, a trade-off arises between risk and return.
Average Returns and Standard Deviations for 11 Stocks, 1994-2006 No obvious pattern here!
Risk and Return Revisited Anheuser-Busch had a higher average return than Archer Daniels Midland, and with smaller volatility. American Airlines had a much smaller average return than Wal-Mart, with similar volatility. The tradeoff between standard deviation and average returns that holds for asset classes does not hold for individual stocks! Standard deviation contains both systematic and unsystematic risk. Because investors can eliminate unsystematic risk through diversification, market rewards only systematic risk.
The Trade-off Between Risk and Return • Investment performance is measured by total return. • Trade-off between risk and return for assets: historically, stocks have higher returns and volatility than bonds and bills. • One measure of volatility: standard deviation • Systematic risk: risk that cannot be eliminated through diversification