Download
1 / 33
330 likes | 377 Vues
Explore the short-run relationship between inflation and unemployment, factors influencing it, policy implications, and the long-run Phillips curve. Learn how expected inflation impacts this trade-off and the impact of supply shocks.

E N D
22 The Short-Run Trade-off Between Inflation and Unemployment Macroeonomics P R I N C I P L E S O F N. Gregory Mankiw Premium PowerPoint Slides by Ron Cronovich
In this chapter, look for the answers to these questions: • How are inflation and unemployment related in the short run? In the long run? • What factors alter this relationship? • What is the short-run cost of reducing inflation? • Why were U.S. inflation and unemployment both so low in the 1990s? 1
Introduction In the long run, inflation & unemployment are unrelated: The inflation rate depends mainly on growth in the money supply. Unemployment (the “natural rate”) depends on the minimum wage, the market power of unions, efficiency wages, and the process of job search. One of the Ten Principles: In the short run, society faces a trade-off between inflation and unemployment. THE SHORT-RUN TRADE-OFF
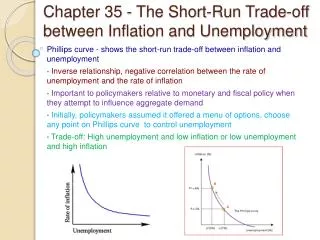
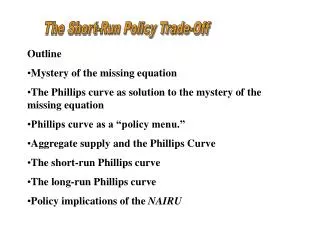
The Phillips Curve Phillips curve: shows the short-run trade-off between inflation and unemployment 1958: A.W. Phillips showed that nominal wage growth was negatively correlated with unemployment in the U.K. 1960: Paul Samuelson & Robert Solow found a negative correlation between U.S. inflation & unemployment, named it “the Phillips Curve.” THE SHORT-RUN TRADE-OFF
Deriving the Phillips Curve Suppose P = 100 this year. The following graphs show two possible outcomes for next year: A. Agg demand low, small increase in P (i.e., low inflation), low output, high unemployment. B. Agg demand high, big increase in P (i.e., high inflation), high output, low unemployment. THE SHORT-RUN TRADE-OFF
Deriving the Phillips Curve P inflation SRAS B B 5% 105 A A 103 AD2 3% PC AD1 Y 6% u-rate 4% Y2 Y1 A.Low agg demand, low inflation, high u-rate B.High agg demand, high inflation, low u-rate THE SHORT-RUN TRADE-OFF
The Phillips Curve: A Policy Menu? Since fiscal and mon policy affect agg demand, the PC appeared to offer policymakers a menu of choices: low unemployment with high inflation low inflation with high unemployment anything in between 1960s: U.S. data supported the Phillips curve. Many believed the PC was stable and reliable. THE SHORT-RUN TRADE-OFF
62 64 Evidence for the Phillips Curve? Inflation rate (% per year) During the 1960s, U.S. policymakers opted for reducing unemployment at the expense of higher inflation 68 66 67 65 1961 63 Unemployment rate (%) THE SHORT-RUN TRADE-OFF
The Vertical Long-Run Phillips Curve 1968: Milton Friedman and Edmund Phelps argued that the tradeoff was temporary. Natural-rate hypothesis: the claim that unemployment eventually returns to its normal or “natural” rate, regardless of the inflation rate Based on the classical dichotomy and the vertical LRAS curve THE SHORT-RUN TRADE-OFF
The Vertical Long-Run Phillips Curve P inflation LRAS LRPC P2 P1 AD2 low infla-tion high infla-tion AD1 Y u-rate Natural rate of output Natural rate of unemployment In the long run, faster money growth only causes faster inflation. 9
Reconciling Theory and Evidence Evidence (from ’60s): PC slopes downward. Theory (Friedman and Phelps):PC is vertical in the long run. To bridge the gap between theory and evidence, Friedman and Phelps introduced a new variable: expected inflation – a measure of how much people expect the price level to change. THE SHORT-RUN TRADE-OFF
The Phillips Curve Equation Short run Fed can reduce u-rate below the natural u-rate by making inflation greater than expected. Long runExpectations catch up to reality, u-rate goes back to natural u-rate whether inflation is high or low. Natural rate of unemp. Unemp. rate Actual inflation Expected inflation a – – = THE SHORT-RUN TRADE-OFF
How Expected Inflation Shifts the PC Initially, expected & actual inflation = 3%,unemployment = natural rate (6%). Fed makes inflation 2% higher than expected, u-rate falls to 4%. In the long run, expected inflation increases to 5%, PC shifts upward, unemployment returns to its natural rate. inflation LRPC 5% 3% PC2 PC1 u-rate 6% 4% B C A THE SHORT-RUN TRADE-OFF
A C T I V E L E A R N I N G 1A numerical example Natural rate of unemployment = 5%Expected inflation = 2%In PC equation, a = 0.5 A.Plot the long-run Phillips curve. B.Find the u-rate for each of these values of actual inflation: 0%, 6%. Sketch the short-run PC. C.Suppose expected inflation rises to 4%. Repeat part B. D.Instead, suppose the natural rate falls to 4%. Draw the new long-run Phillips curve, then repeat part B. 13
LRPCD PCB LRPCA PCD PCC A C T I V E L E A R N I N G 1Answers An increase in expected inflation shifts PC to the right. A fall in the natural rate shifts both curves to the left. 14
62 64 The Breakdown of the Phillips Curve Inflation rate (% per year) Early 1970s: unemployment increased, despite higher inflation. Friedman & Phelps’ explanation: expectations were catching up with reality. 73 71 69 70 68 72 66 67 65 1961 63 Unemployment rate (%) THE SHORT-RUN TRADE-OFF
Another PC Shifter: Supply Shocks Supply shock: an event that directly alters firms’ costs and prices, shifting the AS and PC curves Example: large increase in oil prices THE SHORT-RUN TRADE-OFF
How an Adverse Supply Shock Shifts the PC P inflation SRAS2 SRAS1 B B P2 A A P1 PC2 AD PC1 Y u-rate Y1 Y2 SRAS shifts left, prices rise, output & employment fall. Inflation & u-rate both increase as the PC shifts upward. THE SHORT-RUN TRADE-OFF
The 1970s Oil Price Shocks The Fed chose to accommodate the first shock in 1973 with faster money growth. Result: Higher expected inflation, which further shifted PC. 1979: Oil prices surged again, worsening the Fed’s tradeoff. Oil price per barrel 1/1973 $ 3.56 1/1974 10.11 1/1979 14.85 1/1980 32.50 1/1981 38.00 THE SHORT-RUN TRADE-OFF
The 1970s Oil Price Shocks Inflation rate (% per year) Supply shocks & rising expected inflation worsened the PC tradeoff. 81 75 74 80 79 78 77 73 76 1972 Unemployment rate (%) THE SHORT-RUN TRADE-OFF
The Cost of Reducing Inflation Disinflation: a reduction in the inflation rate To reduce inflation, Fed must slow the rate of money growth, which reduces agg demand. Short run: Output falls and unemployment rises. Long run: Output & unemployment return to their natural rates. THE SHORT-RUN TRADE-OFF
Disinflationary Monetary Policy Contractionary monetary policy moves economy from A to B. Over time, expected inflation falls, PC shifts downward. In the long run, point C: the natural rate of unemployment, lower inflation. inflation LRPC A B C PC1 PC2 u-rate natural rate of unemployment THE SHORT-RUN TRADE-OFF
The Cost of Reducing Inflation Disinflation requires enduring a period of high unemployment and low output. Sacrifice ratio: percentage points of annual output lost per 1 percentage point reduction in inflation Typical estimate of the sacrifice ratio: 5 To reduce inflation rate 1%, must sacrifice 5% of a year’s output. Can spread cost over time, e.g. To reduce inflation by 6%, can either sacrifice 30% of GDP for one year sacrifice 10% of GDP for three years THE SHORT-RUN TRADE-OFF
Rational Expectations, Costless Disinflation? Rational expectations: a theory according to which people optimally use all the information they have, including info about govt policies, when forecasting the future Early proponents: Robert Lucas, Thomas Sargent, Robert Barro Implied that disinflation could be much less costly… THE SHORT-RUN TRADE-OFF
Rational Expectations, Costless Disinflation? Suppose the Fed convinces everyone it is committed to reducing inflation. Then, expected inflation falls, the short-run PC shifts downward. Result: Disinflations can cause less unemployment than the traditional sacrifice ratio predicts. THE SHORT-RUN TRADE-OFF
The Volcker Disinflation Fed Chairman Paul Volcker Appointed in late 1979 under high inflation & unemployment Changed Fed policy to disinflation 1981-1984: Fiscal policy was expansionary, so Fed policy had to be very contractionary to reduce inflation. Success: Inflation fell from 10% to 4%,but at the cost of high unemployment… THE SHORT-RUN TRADE-OFF
The Volcker Disinflation Inflation rate (% per year) Disinflation turned out to be very costly u-rate near 10% in 1982-83 81 80 1979 82 84 83 85 87 86 Unemployment rate (%) THE SHORT-RUN TRADE-OFF
The Greenspan Era • 1986: Oil prices fell 50%. • 1989-90: Unemployment fell, inflation rose. Fed raised interest rates, caused a mild recession. • 1990s: Unemployment and inflation fell. • 2001: Negative demand shocks created the first recession in a decade. Policymakers responded with expansionary monetary and fiscal policy. Alan Greenspan Chair of FOMC, Aug 1987 – Jan 2006 THE SHORT-RUN TRADE-OFF
90 05 1987 94 96 98 02 The Greenspan Era Inflation rate (% per year) Inflation and unemployment were low during most of Alan Greenspan’s years as Fed Chairman. 06 2000 92 Unemployment rate (%) THE SHORT-RUN TRADE-OFF
Ben Bernanke’s challenges • Aggregate demand shocks: • Subprime mortgage crisis, falling housing prices, widespread foreclosures, financial sector troubles. • Aggregate supply shocks: • Rising prices of food/agricultural commodities, e.g., Corn per bushel: $2.10 in 2005-06, $5.76 in 5/2008 • Rising oil prices Oil per barrel: $35 in 2/2004, $134 in 6/2008 • From 6/2007 to 6/2008, • unemployment rose from 4.6% to 5.5% • CPI inflation rose from 2.6% to 4.9% THE SHORT-RUN TRADE-OFF
CONCLUSION The theories in this chapter come from some of the greatest economists of the 20th century. They teach us that inflation and unemployment are unrelated in the long run negatively related in the short run affected by expectations, which play an important role in the economy’s adjustment from the short-run to the long run. THE SHORT-RUN TRADE-OFF
CHAPTER SUMMARY • The Phillips curve describes the short-run tradeoff between inflation and unemployment. • In the long run, there is no tradeoff: inflation is determined by money growth, while unemployment equals its natural rate. • Supply shocks and changes in expected inflation shift the short-run Phillips curve, making the tradeoff more or less favorable. 31
CHAPTER SUMMARY • The Fed can reduce inflation by contracting the money supply, which moves the economy along its short-run Phillips curve and raises unemployment. In the long run, though, expectations adjust and unemployment returns to its natural rate. • Some economists argue that a credible commitment to reducing inflation can lower the costs of disinflation by inducing a rapid adjustment of expectations. 32