Download
1 / 30
300 likes | 387 Vues
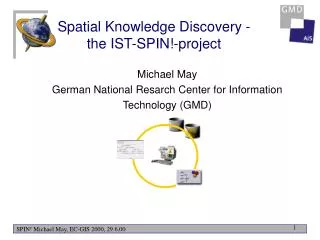
This project by the German National Research Center for Information Technology aims to integrate GIS and Data Mining for spatial data analysis, visualization, and dissemination. It involves developing new techniques for analyzing seismic data, volcano data, and web-based census data dissemination. The system architecture uses advanced learning methods like inductive logic programming and Bayesian Markov Chain Monte Carlo for spatial data analysis. It also includes an internet-enabled map viewer for interactive exploration and thematic map design. Automated cluster detection and explaining spatial phenomena are key components of this innovative project.

E N D
Spatial Knowledge Discovery -the IST-SPIN!-project • Michael May • German National Resarch Center for Information • Technology (GMD)
Motivation • GIS revolution brought an explosion of geographically referenced data, yet few tools to automatically extract useful information • One very interesting development are interactive thematic maps (CDV (Dykes 1997), SAGE (Haining 1998), Descartes (Andrienko & Andrienko 1999)) • Leave room for complementary methods: • Hard to visualize multi-variate dependencies • visual identification of patterns is subjective
Knowledge Discovery in Databases (KDD) • Characterization: • Knowledge discovery in databases is the non-trivial process of identifying valid, novel, potentially useful, and ultimately understandable patterns in data. • (Fayyad, Piatetsky-Shapiro, Smyth 1996)
Data Mining: example task • Predicting crop yield using data on past yield and data about soil condition, climate • detecting credit fraud by spotting unusual transaction patterns • classifying stars by using spectral data
Knowledge Discovery Cycle Visualization & Interpretation Selection & Transformation Data Mining
KeplerPreprocessing • Data selection • Cleaning • Transformation
KeplerExploration • Drill down: exploring the data at different levels of aggregation • Descriptive statistics & visualization
Kepler Data Mining • Decision tree • Regression tree • Subgroup discovery • k-nearest neighbor • ILP (Foil) Decision Trees (DTI) Regression Trees (RT) k-NN Subgroup (Midos) ILP (Foil)
KeplerVisualization Decision Trees Subgroups Rules
Data Mining system generates hypothesis search (and visualization) in abstract space inductive generalizations exceeding content of database GIS user generates hypothesis visualization in geographical space shows what’s inside the data Data Mining vs. GIS Both techniques are exploratory
SPIN! Spatial Mining for data of public interest • German National Research Center for Information Technology (GMD), • University of Bari, Italy; • School of Geography, University of Leeds, UK • Dialogis Software & Services GmbH, Bonn, Germany; • Professional GeoSystems (PGS), Amsterdam, Holland; • Metropolitan and Victoria Univ., Manchester, MIMAS, • IITP, Russian Academy of Sciences, Moscow; • GeoForschungszentrum Potsdam, Germany. • IST-1999-10536 SPIN!, Duration: 1/2000-12/2002 Coordination: GMD, michael.may@gmd.de
SPIN! Objectives • Develop a system architecture integrating state of the art GIS and Data Mining functionality in an open, extensible, internet-enabled architecture • Adapt • - inductive logic programming learning methods and • - Bayesian Markov Chain Monte Carlo to • spatial data • Develop new visualization for Data Mining in GIS • Develop new visualization of temporal and spatial data. • Apply system to • - seismic and volcano data analysis (with GFZ) • - web-based dissemination of census data (with ONS and MIMAS)
Level 1: Data access and management • Provided by data mining platform Kepler • data access to heterogeneous and distributed data sources (RDBMS, flat file, spatial data) • data query and transformation (restriction, projection, union, join, calculated rows) • exploratory non-spatial visualization • organizing and documenting analysis tasks
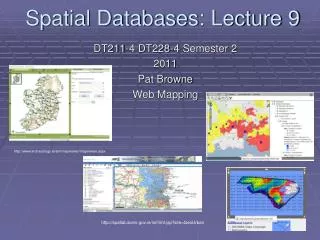
Level 2: Internet-enabled map viewer • Lava/Magma Java-based internet GIS developed by Professional GeoSystems (PGS) • support for zooming, panning etc. • Excellent scalability through client-side caching
Level 1: Data access and management • Provided by data mining platform Kepler • data access to heterogeneous and distributed data sources (RDBMS, flat file, spatial data) • data query and transformation (restriction, projection, union, join, calculated rows) • exploratory non-spatial visualization • organizing and documenting analysis tasks
Level 2: Internet-enabled map viewer • Lava/Magma Java-based internet GIS developed by Professional GeoSystems (PGS) • support for zooming, panning etc. • Excellent scalability through client-side caching
Level 3: Interactive thematic maps • Knowledge-based map design(Andrienko & Andrienko 1999) • Dynamic maps allowing interactive manipulation Rule base on map design Data characterization: types and relationships Map designer Selected data subset
Level 4: Automated cluster detection:GAM/K • searching for localised spatial clustering • examining circles of varying sizes that cover the region of interest • compare relative frequency with expected value • retain significant circles • apply kernel smoothing • Openshaw 1998, 2000
Level 5: Explaining clusters and spatial phenomena • Assume we have produced a classification or clustering using either Descartes or GAM: • What attributes are associated with a cluster and could potentially explain it?
Example: GIS & decision trees Thematic Map Decision Tree
Using Inductive Logic Programming • Learning approach based on first-order predicate logic • can express relations between instances • greater representational power compared to attribute-value learners using ‘single-table data’ • Topological relations such as adjacent_to, close_to, inside can be included search for explanations • crime_hotspot(X) :- • city(Z), • high_unemployment(Z), • train_station(Y), • inside(Y,Z), • close_to(X,Y). Topological predicates
Tasks for Merapi application • Estimation of possible future eruption • Combining information about land use/land cover, infrastructure and population in order to make a damage assessment. • Dissemination of information for volcano risk mitigation over the Internet.
Web-based dissemination ofcensus data • MIMAS disseminates UK census data to the UK academic sector • Using SPIN!-technology for providing additional value to the mere distribution of data • UK Unitary development plans, selected application area: Manchester Stockport • Forecasting numbers of houses needed • Allocation of land • Development control
Conclusion • Integration of Data Mining and GIS is a logical progression of spatial data analysis technology • Integrating interactive statistical maps in the knowledge discovery process improves the visualization and interpretation step of KDD • Map based data analysis can be supplemented by data mining methods for potential explanations of patterns • First prototype expected by the end of the year 2000!