Reliability Predictions
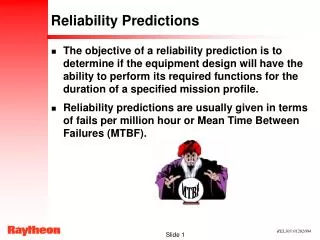
MTBF. Reliability Predictions. The objective of a reliability prediction is to determine if the equipment design will have the ability to perform its required functions for the duration of a specified mission profile.

Reliability Predictions
E N D
Presentation Transcript
MTBF Reliability Predictions • The objective of a reliability prediction is to determine if the equipment design will have the ability to perform its required functions for the duration of a specified mission profile. • Reliability predictions are usually given in terms of fails per million hour or Mean Time Between Failures (MTBF).
Reliability Predictions • Besides their obvious use to predict reliability, reliability predictions are used to support many other analyses such as: • Spares • Failure Mode Effects and Criticality Analysis (FMECA) • Fault Tree • Warranty • Performance Based Logistics (PBL) Why are Spares so important?
Reliability PredictionsSpares • Why do you need spare boards or boxes? Why not just fix the ones that fail? You do fix the ones that fail, but that takes time. The equipment is unavailable while the repair is made. • Spares allow the equipment to be made available more quickly. • The Reliability Prediction determines how many spares will be needed to meet the customers availability requirements. • Operational Availability (Ao) is often a key customer requirement. • Ao = System Up Time / Total Time or • MTBF/(MTBF + MTTR + MLDT) MTTR = Mean Time To Repair MLDT = Mean Logistics Delay Time
Reliability Predictions • There are many methods to predict the reliability of a system including: • MIL-HDBK-217 • Telcordia (Bellcore) • PRISM • Physics of Failure • Comparative Analysis
Reliability Predictions • MIL-HDBK-217, "Reliability Prediction of Electronic Equipment” • The original reliability prediction handbook published by the Department of Defense, based on work done by the Reliability Analysis Center and Rome Laboratory • Contains failure rate models for the various part types used in electronic systems, such as ICs, transistors, diodes, resistors, capacitors, relays, switches, connectors, etc. • Failure rate models are based on field data obtained for a wide variety of parts and systems. This data was analyzed and many simplifying assumptions were thrown in to create usable models.
Reliability Predictions • MIL-HDBK-217 includes mathematical reliability models for nearly all types of electrical and electronic components. The variables in these models are parameters of the components such as number of pins, number of transistors, power dissipation, and environmental factors. • MIL-HDBK-217 contains two methods of performing predictions. • Parts Count - normally used early in the design and is based on anticipated quantities of parts to be used • Parts Stress – normally used later in the design and is based on the stresses applied to each individual part
i=n Equip = Ni(gQ)i i=1 Reliability Predictions • MIL-HDBK-217 Parts Count Prediction • The general mathematical expression for equipment failure rate with this method is: Equip= Total equipment failure rate g = Generic failure rate for the ith generic part Q = Quality factor for the ith generic part Ni = Quantity of the ith generic part n = # of different generic part categories in equipment
Reliability Predictions • MIL-HDBK-217 Parts Count Prediction Example • A new RF amplifier board for use in an external pod mounted radar for a fighter aircraft is anticipated to use 46 insulated film (RLR, MIL-R-39017) resistors of established reliability category “R”. Determine the portion of the failure rate due to these resistors.
Reliability Predictions • MIL-HDBK-217 Parts Count Prediction Example • A new RF amplifier board for use in an external pod mounted radar for a fighter aircraft is anticipated to use 47 insulated film (RLR) established reliability level “R” resistors. Determine the portion of the failure rate due to these resistors. Res(RLR) = Ni(gQ) Res(RLR) = 47 X (.033 X .1) Res(RLR) = .1551 fails/million hours NOTE: This is the failure rate associated with only this type of resistor. To get the complete failure rate for the board, the failure rates for all other resistor types and for all other components would have to be added.
Microprocessor Reliability Predictions • MIL-HDBK-217 Parts Stress Prediction • For this method, different types of parts (resistors, capacitors, microcircuits, etc.) and different classes of parts of the same type (memory, microprocessors, etc.) have different failure rate equations. • A separate failure rate is determined for each part based on the stresses applied to that part. These failure rates are added to determine the total failure rate for the unit being analyzed. Fixed Film Resistor DRAM p = b RQ E p = (C1T + C2E)Q L p = (C1T + C2E + cyc)Q L
Reliability Predictions • MIL-HDBK-217 Parts Stress Prediction Example • Reference Designator R6 (133 ohm, RLR, MIL-R-39017, established reliability level “R”) on an RF amplifier board for use in an external pod mounted radar for a fighter aircraft has been shown to operate at 48 C at 30% of its rated power. Determine the portion of the failure rate due to this resistor. MIL-HDBK-217 Parts Stress equation for this type of part is: p = b RQ E
Reliability Predictions • MIL-HDBK-217 Parts Stress Prediction Example • Reference Designator R6 (133 ohm, RLR, MIL-R-39017, established reliability level “R”) on an RF amplifier board for use in an external pod mounted radar for a fighter aircraft has been shown to operate at 48 C at 30% of its rated power. Determine the portion of the failure rate due to this resistor. R6 = b RQ E b = .0011 R = 1.0 Q = 0.1 E = 18 R6 = .0011 X 1.0 X 0.1 X 18 = .00198 fails/million hours
Reliability Predictions • Telcordia (Bellcore) • Originally developed by Bell Labs • Bell Labs modified the equations in MIL-HDBK-217 to better represent what their equipment was experiencing in the field. • Tends to be a lot more forgiving of nonmilitary parts than MIL-HDBK-217 • Methodology is very similar to MIL-HDBK-217 – If you know how to use one, you can use the other.
Reliability Predictions • Now for the Bad News • Opinions of both of these methods (MIL-HDBK-217 and Telcordia) are very low in many quarters. • Both have very poor track records predicting actual field performance though they may be useful in making comparisons between competing system designs. • The biggest strength of both of these methods is that they provide a recognized systematic methodology which minimizes the need to make “judgments”; however, … • This strength lasts only as long as customers continue to “recognize” these methods as valid and this situation is changing with some customers prohibiting their use. In addition, whether “recognized” or not, the basic problem remains - these methodologies provide poor answers for a critical question.
Reliability Predictions • PRISM • Modification of MIL-STD-217 • Attempt by RAC to overcome some of MIL-STD-217’s problems • Does not include models for all commonly used devices • Provides the ability to update predictions based on test data • Addresses factors such as development process robustness • Values of individual factors are determined through an extensive question/answer process to judge the extent that measures known to enhance reliability are used in design, manufacturing and management processes.
Failure Cause Distribution for Electrical Systems (Based on RAC Survey) Reliability PredictionsPRISM • PRISM software reliability prediction tool developed by the Reliability Analysis Center (RAC) • Mil-HDBK-217 and Telcordia address only part failures • PRISM introduces the use of “process grades” • PRISM allows 2 types of predictions • Inherent reliability • Logistics model • PRISM accounts for failure sources in addition to part failures • PRISM uses a model consisting of additive and multiplicative terms • Based on failures/106 calendar hrs • Clndr Hrs = Op Hrs / Duty Cycle
RACRate model • Microcircuits • Transistors • Diodes • Thyristors • Capacitors • Resistors • Software • RAC data • Electronics Parts Reliability Data • Nonelectronic Parts Reliability Data • User-defined data • Process grades in 9 areas • Parts • Design • Induced • System Mgmt. • No-defect • Manufacturing • Wearout • Infant Mortality • Reliability Growth Reliability PredictionsPRISM • Sys Fail Rate = (S component failure rates) x process grade factor
Software not included in Raytheon evaluation Parts Design Manufacturing SystemMgmnt Wearout System-level process grade multiplier (approximately 1.0 for “average” processes) Reliability PredictionsPRISM Failure Rate Models lP(Inherent) = lIA (PPPIMPE + PDPG + PMPIMPEPG + PSPG +PW) + lSW lP(Logistics) = lIA (PPPIMPE + PDPG + PMPIMPEPG + PSPG +PI+ PN + PW) + lSW PI Induced process grade factor PN No-defect process grade factor
Reliability Predictions • Physics of Failure (PoF) • Attempt to identify the "weakest link" of a design to ensure that the required equipment life is exceeded • Generally ignores the issue of manufacturing defect escapes and assumes that product reliability is strictly governed by the predicted life of the weakest link • Models are very complex and require detailed device geometry information and materials properties • In general, the models are more useful in the early stages of designing components, but not at the assembly level.
Reliability PredictionsComparative Analysis • Predictions based on field data for similar products can be very useful, but suffer from the following problems. • Accurate field data is often not available • Usually requires making engineering judgments (to compensate for different operating environment, failures that now have C/A in place, etc.) This is the preferred method if good data exists.
Reliability PredictionsComparative Analysis Example: MTBF Prediction for ABX Radar Modified by removing failures with C/A in place. Modified to account for more severe ABX environment.
Reliability Predictions • Summary • A number of different methods exist for predicting reliability. • No prediction method is without its problems. • The Reliability Engineer together with the supportability IPT must pick the best method or combination of methods for his program.