Reliability
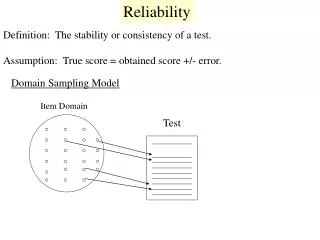
Reliability. Consistency in testing. Types of variance. Meaningful variance Variance between test takers which reflects differences in the ability or skill being measured Error variance


Reliability
E N D
Presentation Transcript
Reliability Consistency in testing
Types of variance • Meaningful variance • Variance between test takers which reflects differences in the ability or skill being measured • Error variance • Variance between test takers which is caused by factors other than differences in the ability or skill being measured • Test developers as ‘variance chasers’
Sources of error variance • Measurement error • Environment • Administration procedures • Scoring procedures • Examinee differences • Test and items • Remember, OS = TS + E
Estimating reliability for NRTs • Are the test scores reliable over time? Would a student get the same score if tested tomorrow? • Are the test scores reliable over different forms of the same test? Would the student get the same score if given a different form of the test? • Is the test internally consistent?
Reliability coefficient (rxx) • Range: 0.0 (totally unreliable test) to 1.0 (perfectly reliable test) • Reliability coefficients are estimates of the systematic variance in the test scores • lower reliability coefficient = greater measurement error in the test score
Test-retest reliability • Same students take test twice • Calculate reliability (Pearson’s r) • Interpret r as reliability (conservative) • Problems • Logistically difficult • Learning might take place between tests
Equivalent forms reliability • Same students take parallel forms of test • Calculate correlation • Problems • Creating parallel forms can be tricky • Logistical difficulty
University of Michigan English Placement Test (University of Michigan English Placement Test Examiner’s Manual)
Internal consistency reliability • Calculating the reliability from a single administration of a test • Commonly reported • Split-half • Cronbach alpha • K-R20 • K-R21 • Calculated automatically by many statistical software packages
Split-half reliability • The test is split in half (e.g., odd / even) creating “equivalent forms” • The two “forms” are correlated with each other • The correlation coefficient is adjusted to reflect the entire test length • Spearman-Brown Prophecy formula
Calculating split half reliability Odd Mean 1.83 2 1 SD 0.75 1 3 3 2 Even 2 0 Mean 1.33 2 2 SD 1.21 1 0
Calculating split half reliability (2) 0.17 -0.33 -0.056 1.67 -1.386 -0.83 1.17 0.67 0.784 -1.33 -0.226 0.17 0.114 0.17 0.67 -0.83 -1.33 1.104 0.334
2 x 0.06 (2 – 1)0.06 +1 Calculating split half 0.334 = 0.06 (6)(.75)(1.21) Adjust for test length using Spearman-Brown Prophecy formula rxx =0.11
(0.75)2 + (1.21)2 2 (1 - ) (1.47)2 Cronbach alpha • Similar to split half but easier to calculate = 0.12
K-R20 • “Rolls-Royce” of internal reliability estimates • Simulates calculating split-half reliability for every possible combination of items
K-R20 formula Note that this is variance, not standard deviation Sum of Item Variance = the sum of IF(1-IF)
K-R21 • Slightly less accurate than KR-20, but can be calculated with just descriptive statistics • Tends to underestimate reliability
KR-21 formula Note that this is variance (standard deviation squared)
Test summary report (TAP) Number of Items Excluded = 0 Number of Items Analyzed = 40 Mean Item Difficulty = 0.597 Mean Item Discrimination = 0.491 Mean Point Biserial = 0.417 Mean Adj. Point Biserial = 0.369 KR20 (Alpha) = 0.882 KR21 = 0.870 SEM (from KR20) = 2.733 # Potential Problem Items = 9 High Grp Min Score (n=15) = 31.000 Low Grp Max Score (n=14) = 17.000 Split-Half (1st/ 2nd) Reliability = 0.307 (with Spearman-Brown = 0.470) Split-Half (Odd/Even) Reliability = 0.865 (with Spearman-Brown = 0.927)
Standard Error of Measurement If we give a student the same test repeatedly (test-retest), we would expect to see some variation in the scores 50 49 52 50 51 49 48 50 With enough repetition, these scores would form a normal distribution We would expect the student to score near the center of the distribution the most often
Standard Error of Measurement • The greater the reliability of the test, the smaller the SEM • We expect the student to score within one SEM approximately 68% of the time • If a student has a score of 50 and the SEM is 3, we expect the student to score between 47 ~ 53 approximately 68% of the time on a retest
Interpreting the SEM For a score of 29: (K-R21) 26 ~ 32 is within 1 SEM 23 ~ 35 are within 2 SEM 20 ~ 38 are within 3 SEM
Calculating the SEM What is the SEM for a test with a reliability of r=.889 and a standard deviation of 8.124? SEM = 2.7 What if the same test had a reliability of r = .95? SEM = 1.8
Reliability for performance assessment Traditional fixed response assessment Performance assessment (i.e. writing, speaking) Test-taker Test-taker Task Instrument (test) Performance Scale Score Score Rater / judge
Interrater/Intrarater reliability • Calculate correlation between all combinations of raters • Adjust using Spearman-Brown to account for total number of raters giving score