Download
1 / 13
130 likes | 209 Vues
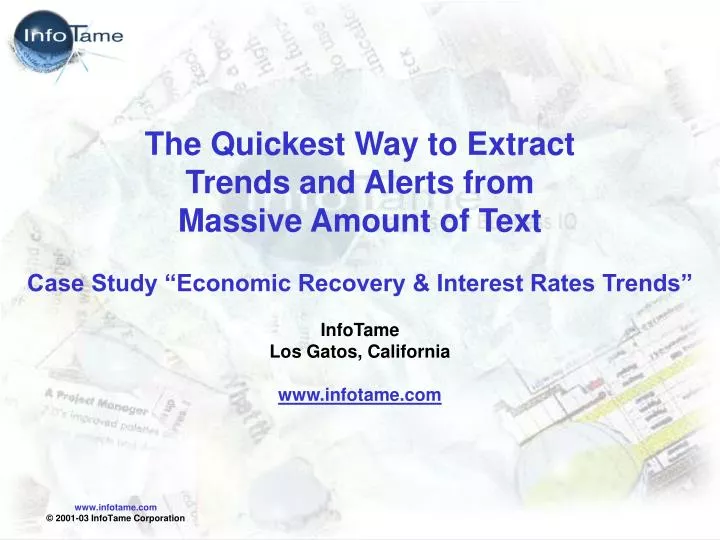
The Quickest Way to Extract Trends and Alerts from Massive Amount of Text Case Study “Economic Recovery & Interest Rates Trends”. InfoTame Los Gatos, California www.infotame.com. Back to Year 2000: When Is The Next Recession Due?.

E N D
The Quickest Way to ExtractTrends and Alerts fromMassive Amount of TextCase Study “Economic Recovery & Interest Rates Trends” InfoTame Los Gatos, California www.infotame.com
Back to Year 2000:When Is The Next Recession Due? • Economic recessions are repeating but not periodic events. They always come but at rather irregular intervals. • How can you anticipate the next one on the horizon?
NASDAQ Composite, Dec ‘99 – Nov ‘01 Can NASDAQ Predict Recession? • There is a common wisdom that stock market declines of a significant magnitude signal a recession ahead. • But which substantial decline during the bear market in 2000-2001 was a true recession signal? • What was the lead time to the recession onset? • Which index is the best predictor?
Object “NASDAQ”, Mar ’00 – Sep ‘01 • Instead of looking at numbers, we used InfoTame to analyze text data: over 1,000,000 news clips for the March 2000 – September 2001 period. • The histogram shows the number of articles containing the word “NASDAQ” for each month. • We then further analyzed these 15,511 documents for the most statistically significant associations for each time period. • “Recession” was one such association and here is what we found.
“Recession” significance; Object “NASDAQ”, Mar 2000 - Sep 2001 Zero significance of “Recession” prior to Dec ‘00 Significance Values M A M J J A S O N D J F M A M J J A S InfoTame Indicated Onset of Recession 2001back in Dec 2000 • The significance of “Recession” was zero through November 2000. Then it jumped in December 2000 and grew further in January 2001. From other studies based on correlations of significance of a given topic and the real world events, we know that InfoTame mirrors the trends as they unfold. The significance values calculated by InfoTame’s analytics engine reflect the collective wisdom buried within the 15,511 articles talking about NASDAQ and saying something once in a while about recession. No analyst, or a group of analysts, having read all these articles and news clips, could make sense of how the occasional mention of recession related to the ups and downs of NASDAQ in each of the monthly periods. • InfoTame, however, found that there was something significantly different about the way “recession” was mentioned in the 1,051 articles in Dec 2000 and the 960 documents of Jan 2001, compared to thousands of documents for The Mar-Nov period of 2000, when significance of “recession” was zero.
Recession Announced Nov 26 ‘01 • Much later, all of us learned that the US economy entered the recession around June 2001, and perhaps as early as March 2001. • It appears that InfoTame first indicated recession on the horizon after analysis of 1,051 documents for Dec 2000. • The recession alert came 3-6 months before the recession started.
“Recession” significance; Object “NASDAQ”, Mar 2000 - Sep 2001 M A M J J A S O N D J F M A M J J A S Timing Of The Recession Of 2001 When did NASDAQ charts signal the next recession? InfoTame indicated recession several months ahead, in Dec ‘00 Recession acknowledged on Nov 26, 2001
More Recent Trends: 2000-2003 • The following slides show longer term trends for the 15 quarters, from April 2000 to December 2003 • Extracted from queries “Interest Rates” and “NASDAQ”, we plot the significance of terms: • “Economic Slowdown” • “Economic Recovery” • “Cut Rate” • “Rate Hike” • “Raise Interest” • “Budget Deficit”
Recession acknowledged on Nov 26, 2001 ITee Indicates Recession And Then Recovery Query “Interest Rates” Recession Mar-Nov 2001 ITee gives first alert in Dec 2000 ITee signals subsequent recovery Dec Dec Dec Dec 2000 2001 2002 2003
ITee Detects Re-Emergence Of Budget Deficit Query “Interest Rates” Recession Mar-Nov 2001 Re-emergence of Budget Deficit Dec Dec Dec Dec 2000 2001 2002 2003
ITee Indicates The End Of Interest Rates Cuts Query “Interest Rates” Recession Mar-Sep 2001 Dec Dec Dec Dec 2000 2001 2002 2003
ITee Indicates Possible Rates Hikes Ahead Query “NASDAQ” Recession Mar-Sep 2001 Are we done with Rate Cuts? Re-emergence of Rate Hikes? Dec Dec Dec Dec 2000 2001 2002 2003
ITee Indicates Continuing Economic Recovery Query “NASDAQ” Recession Mar-Sep 2001 Dec Dec Dec Dec 2000 2001 2002 2003