Download
1 / 46
480 likes | 519 Vues
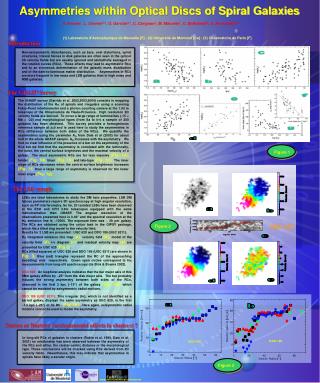
Explore differential rotation in spiral galaxies through disk kinematics and rotation curve analysis. Learn about Milky Way's mass distribution and velocity measurements. Discover gas motions and molecular clouds in galactic disks.

E N D
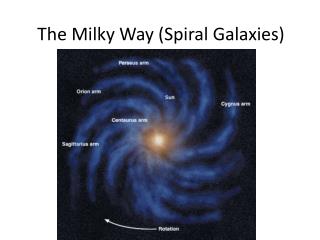
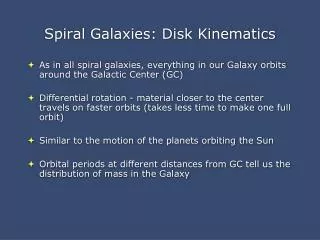
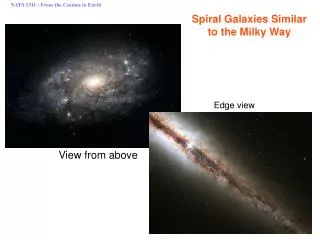
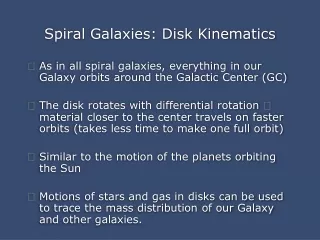
Spiral Galaxies: Disk Kinematics • As in all spiral galaxies, everything in our Galaxy orbits around the Galactic Center (GC) • The disk rotates with differential rotation material closer to the center travels on faster orbits (takes less time to make one full orbit) • Similar to the motion of the planets orbiting the Sun • Motions of stars and gas in disks can be used to trace the mass distribution of our Galaxy and other galaxies.
M(R) = 0R (r) dV Motion at radius R depends only on M(R) Objects responding to M(R) behave as if M(R) is centrally concentrated For an object with mass m at R, gravity balance acceleration of circular motion GM(R)m/R2 = mv2/R M(R) = v(R)2R/G Measure v(R) and get M(R) M v R m Let (R) = v(R)/R, then M(R) = (R)2R3/G v(R) or (R) is the rotation curve of the galaxy
To determine galaxy rotation curve, define Galactic Coordinates b = galactic latitude in degrees above/below Galactic disk l = galactic longitude in degrees from GC Differential galactic rotation produces Doppler shifts in emission lines from gas in the Galactic disk
The Sun (and most stars) are on slightly perturbed orbits (deviate slightly from perfect circular motion). Must determine Sun motion wrt pure circular motion by looking at average motions of all stars in the Sun’s vicinity. Local Standard of Rest (LSR) - reference frame for measuring velocities in the Galaxy. This would be the position of the Sun if its motion were completely governed by circular, orbital motion around the Galaxy • V = Vy (velocity in direction of galaxy rotation) • U= Vx(velocity towards GC) = 10 km/s • W = Vz(velocity towards NGP) = 7.2 km/s • V depends on color – stellar pops • asymmetric drift – mean Vrot of stellar pop lags behind LSR more and more with increasing σ of stars. • Comparing sun to this reference frame produces V which grows with lag • Fit to data gives at S2 = 0, V = 5.2 km/s
With respect to the LSR, the Sun is moving at about ~15.4 km/s towards l=53 degrees b=23 degrees and lies about 10-20 pc above the Galactic plane. Use this to correct doppler shift measurements to get radial velocity of object wrt LSR. Position and Velocity of LSR in Galaxy (adopted in 1985 by IAU; based on globular cluster positions) Ro = 8.5 kpc Vo = 220 km/s Other values: 8 kpc and 200 km/s (SG 2.3 and Eisenhauer et al. 2003) 8.4 +/- 0.6 kpc and 254 +/- 16 km/s (Reid et al. 2009)
To map out vr throughout Galaxy, divide the Galaxy into quadrants based on value of galactic longitude. Quad I (l<90) - looking to material closest to GC, [(R) - 0] gets larger and vr increases. At point of closest approach (subcentral point) vr is at maximum for that los and then continues to decrease to Sun’s orbit. Beyond Sun’s orbit, vr becomes negative and increases in absolute value. Quad II (90<l<180) - all los pass through orbits outside of the Sun’s. No maximum vr but absolute values increase with d. Quad III (180<l<270) - similar to Quad II but opposite signs. Quad IV (l>270) - similar to Quad I except reverse signs.
Determination of Rotation Curve of the Milky Way • Determined from 21-cm line observations • Assume circular orbits and that there is at least some Hydrogen all along any given line-of-sight • Especially important to have measure of gas at subcentral point
Find maximum shift of 21-cm line along given los • Assign that Doppler shift to material at the subcentral point (closest approach to GC) • Rmin = Ro sin l • (Rmin) = [vmax/(Ro sin l)] + o • By studying los longitude values from 0 to 90 degrees, Rmin will range from 0 to Ro • Limitations • No gas at subcentral point • Non-circular orbits • At Rmin = 0 and at Ro, difficult to measure curve (small Doppler velocity hard to determine)
Since there is no maximum Doppler shift for los directed away from GC, rotation curve beyond Ro is more difficult – must measure velocity and distance of material independently • Molecular Clouds • velocity from radial velocities of CO emission • distance from stars exciting clouds (spectroscopic parallax) From tangent point method with Vo= 200 km/s Compares HI gas slightly above and below plane Rotation speed of outer Galaxy Vo = 200 km/s and 220 km/s
Spiral Galaxies: gas motions in galactic disks • Disks are dominated by ordered motion rotation • Vmax = 50 – 400 km/s (most between 150-300 km/s) • σ (gas) = 5 – 10 km/s • σ (stars) = 5 – 50 km/s • -compare with Ellipticals σ = 50 – 500 km/s Gas measured from Hα – ionized gas from disk HII regions HI (21cm) – atomic gas – allows us to “see” beyond disk stellar edge CO (2.6mm) – molecular gas (CO used to estimate H2) HI in disks is optically thin – little absorption so mass ≈ intensity *though in MW HI distribution can be hindered by dust in disk *emission can become optically thick (mass ≠ intensity) Deep HI maps detect ~1019 H atoms/cm2 or 0.1M/pc2 Example: NGC 7331 contains 1.1 x 10¹⁰M HI gas
Ratio of galaxy mass in gas increases with later Hubble type Mgas = MHI + MH2 Mdyn = dynamical estimate of total mass Spiral galaxies vary in the amount of molecular to neutral Hydrogen (50% to 10%)
Distribution of HI in external galaxies • centers of disk galaxies are generally gas poor, gas is piled in a ring several kpc out (also seen in MW and M31) • more gas than stars in outer regions (little SF) HI gas in NGC 7331 HI gas in NGC 5033 (Sc) HI surface density vs radius
Example: Andromeda HI - 21cm FIR (SF & dust) CO - 2.6micron Optical • CO displays sharp drop with radius • Traces spiral arms • CO more associated with arms than HI which permeates galaxy (except in center) • CO velocity map shows rotation
Compare to Distribution of HI and H2 gas in the Milky Way • HI gas - mass does not decrease very quickly (mass interior to Ro = 109 Msun and outside Ro is 2x10⁹ Msun) • H2 gas - falls off rapidly (109 Msun inside Ro and 5x10⁸ Msun outside) • Feature in H2 called “molecular ring”
Correlations with molecular gas content in galaxies • tight correlation between molecular gas content, radio continuum emission, and IR luminosity Molecular gas (CO emission line strength) Radio continuum Radio continuum mid-IR luminosity • Mid-IR from UV photons (from stars) converted to IR via dust • Radio continuum from 1) free-free radiation in hot ionized gas and 2) synchrotron from SNe remnants • cool gas, SF, SNe – all related to the formation of massive stars in galactic disks
Spiral Galaxy Velocity Fields At radius R, assume a gas cloud follows near-circular path with speed V(R) Measure Vr (radial velocity) doppler shift Velocity at galaxy center is Vsys, the systemic velocity Observe a disk in pure circular motion at inclination i For a star or gas cloud at radius R and azimuth ϕ, the radial velocity is Vr(R,i) = Vsys + V(R) sini cosϕ
Contours of constant Vr connect points with the same value V(R)cosϕ spider diagram A B for disk inclined 30 degrees lines of constant Vr-Vsys radius R/Rd • line AB is the kinematic major axis – deviates furthest from Vsys • center line (minor axis) is close to Vsys – all motion tangential • Near center, lines are almost parallel to center line since V(R) goes as R (solid body) • Further out, where rotation speed becomes almost constant, lines bend toward radial direction
Distorted Spider Diagrams: Kinematic Warps • most galaxy spider diagrams show deviations from pure circular motion • explained by warps in disk – tilted ring model • HI maps of edge-on disks also reveal warps M83 – model and data for less-inclined disk warp Edge-on warp
Distorted Spider Diagrams: Oval Orbits • gas moves in oval (elliptical) rather than circular motions - effects on velocity fields: • kinematic axes not perpendicular • kinematic and photometric minor axes not aligned • kinematic major axis close to line-of-nodes (line through galaxy’s center that lies in sky plane and galaxy’s equatorial plane) line of nodes disks inclined by 1 degree (almost face-on) left panel – photometric major axis at 70 degrees from LON right panel – photometric major axis at 20 degrees from LON
Spiral Galaxy Rotation Curves: • evidence for Dark Matter • V(R) is of fundamental importance for determining M(<R) since • V2(R)= GM(<R)/R V ~ sqrt(M/R) • For NGC7331, compare observed rotation curve with what we expect if the galaxy mass is entirely in stars and gas • assume stellar (bulge/disk) density ~ R-band light and typical M/L • assume gas surface density (disk) is 1.4 x HI intensity • adjust M/L so that gas and stars in disk account for as much of the galaxy’s rotation as possible maximum disk model • Rotation curve should begin to fall at R ~ 20 kpc if only stars/gas important. 75% of mass is in a Dark Matter Halo
Dark Matter vs. Hubble type Sa – Sb: longer scale lengths, more rapid rotation ~50% DM needed V(R) climbs steeply more mass close to center Sd – Sm: shorter scale lengths, slower rotation ~80 – 90% DM needed V(R) climbs more gradually lacks central concentration
What mass distribution is required for a flat rotation curve? • for spherical symmetry • • if V is constant, M(R) ~ R • where V=Vmax at large R • Density falls as R-2 for a flat rotation curve (slower than an exponential decrease) • What is the distribution of the Dark Matter Halo? • N-body simulations of gravitational clustering suggest • NFW law • where ρo and a are free parameters (Navarro, Frank & White 1997) • but fits can be made w/very different values of free parameters depending on the adopted M/L for disk & bulge Mo r(a+r)2
Trends with Luminosity Galaxies with larger L have larger Vmax Galaxies with larger L have shorter radii of solid-body rotation Fraction of DM inside optical radius increases with decreasing Vmax DM is less concentrated than the luminous matter 2-component maximum disk models
Kinematics from single emission line Quick way to get Vmax measure width of 21-cm HI emission w/single dish radio telescope W Double-horned profile results from flat rotation curve W ≈ 2 Vmax sin i Measurements like this for many galaxies revealed... Tully-Fisher relation L ~ Vmax4 Distance Indicator! brighter galaxy more massive faster rotation Usually use red or IR light for L to minimize effects of recent SF
Tully Fisher In I-band LI/4x1010LI,= (Vmax/200km/s)4 In H-band LH/3x1010LH,= (Vmax/196km/s)3.8 Galaxies in Ursa Major group based on HI global profile W/sin i = 2Vmax. Open circles are LSB galaxies. TF can be dynamically understood without DM. But, since Vmax comes largely from DM and L from luminous matter, we see “coordination” between DM and LM.
Determining Vmax for distant galaxies to look for evolution in TF relation Using optical light to get rotation curves HST (ACS) HST ACS model residual [OII] [OII] residual model
Tully-Fisher Evolution • Comparing TFR at 0.9 < z < 1.4 to Nearby Field Galaxy Survey sample (Kannappan et al. 2002) • Offset (assumes no slope change): • -1.7 mag at z~1.1 • rotating disks 1.7 mag brighter at <z>=1.1 than locally (Metevier et al 2006)
Disk Galaxies: Gas Metallicity trend with Radius Measure strength of emission lines in HII regions relative to H lines (e.g. Hβ) O+ (3727Å), O2+ (5007Å), N+ (6583Å), S+ (6724Å) and correct for reddening and underlying stellar absorption strength of both O+ and N+ fall w/radius; N+ falls faster Interstellar abundances of metals in disk galaxies declines w/galactic radius Since N is a secondary element, its abundance should be [N/H] ~ 2[O/H] Observed [N/H] ~ 1.5[O/H] Central [O/H] values increase with galaxy magnitude and Vmax (due to TF; Zaritsky et al 1994) Dors and Copetti (2005) for M101
Disk Galaxies: Gas Metallicity trend with mass • Metallicity higher for more massive galaxies – MZ relation • Metallicity lower at higher redshift at the same mass • Metallicity at z~2.3 is less than local galaxies at the same mass and further from local relation at lower masses (red circles) • Also observed at z~1 (blue circles) • evidence for evolutionary downsizing higher mass galaxies evolve onto the local MZ relation at earlier times. Henry et al. 2013
Why the decline of metallicity with radius? • Consider closed-box model of chemical evolution (BM 5.3.1) • Z = -p ln fgas • Z = Mheavyelements/Mgas p = nucleosynthesis yield from stars • fgas = fraction of mass density in gas • gas fraction lower near center of Sa/Sb galaxies • metallicity decreases w/radius • (trend prediction is correct but not quantitative) • Closed-box model predicts constant p (yield), but to match observed trends, p must vary throughout disk – larger at small R and high Z • What else may be happening? • gas drifts inward – carries metals inward • gas replaced at large radii by accretion of metal-poor gas from IGM
Disk Galaxies: stellar ages and metallicities Using old, giant branch stars, determine stellar metallicity vs radius. Decrease in metallicity with R until 15 kpc, then flat. Is this the halo? Probably not since halo [Fe/H] is usually lower metallicity ([Fe/H] ~ -1.5). What is the reason for the flattening of the relation at large R? Vlajic et al 2009
Milky Way disk: stellar and cluster metallicities • Galactic metallicity decreases with radius and levels beyond R =10 – 12 kpc • α-elements produced in Type II SNe are enhanced at large R (more recent SF) • consistent with progressive growth of the Galactic disk with time and episodic enrichment by Type II SNe (e.g. recent enrichment caused by enhanced SF from minor mergers) blue open and green = open clusters red = field stars black plus = Cepheid variables
Milky Way disk: metallicity with vertical height • [Fe/H] for 200,000 F,G stars in sdss • metallicity distribution of the halo component is Gaussian with mean [Fe/H] = −1.46 • disk metallicity distribution is non- Gaussian, with small scatter • median smoothly decreasing with distance from the plane from −0.6 at 500 pc to −0.8 beyond several kpc Hayden et al. 2015 Ivezic et al (2008)
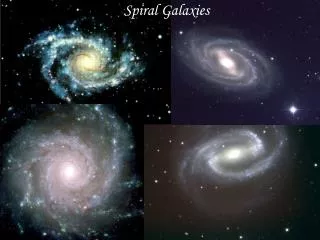
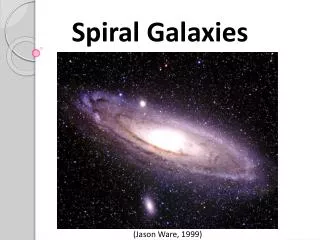
Spiral Galaxies: Spiral Structure • Almost all giant galaxies with gas in their disks display spiral structure • Arms are blue regions of active star formation • Both ionized (Hα) and cool gas (HI) concentrate in arms • Shape of m-armed spiral • Function f describes tightness of spiral (large df/dr = closely wrapped arms) • Pitch angle angle between arms and tangent to circle at R angle i • Sa: i = 5 degrees • Sc: i = 10 to 30 degrees • Spiral arms are almost always trailing – tips point in direction opposite rotation • Spiral shape not caused by galaxy’s differential rotation
Spiral Structure – Winding Dilemma For MW @ location of the Sun, V(R) = 200 km/s and R = 8 kpc What is pitch angle? Recall Ω(R) = V/R and V is const w/R Cot i ~ 200/8 * t i = 2 degrees x (1 Gyr/t) Spiral arms structure would be too tightly wound after ~1 Gyr due to differential rotation - Eventually spiral structure is “smeared out”.
Density Waves in Spiral Galaxies Spiral arms are caused by the compression of gas as it orbits the Galactic center and encounters density waves that are essentially stationary. Compression of gas causes stars to form which we see as spiral arms. • Cloud approaches arm at a relative speed of ~100km/s. • Arm acts as gravitational well, slowing down the cloud. • Arm will alter orbits of gas/stars, causing them to move along arm briefly. • Compresses HI gas and gathers small MCs to form GMCs. • GMCs produce O&B stars. • Stellar radiation disrupts the clouds.
Self-propagating Star Formation Grand design spirals are best explained via the density wave theory for spiral structure. Flocculant spirals may be dominated by self-propagating star formation, resulting in more temporary patterns, drawn into spiral-like shapes due to the rotation of the galaxy. The formation of stars drives the waves – shock waves from the later evolution of stars creates denser regions where new stars are created. Flocculant spiral M33
How is the spiral pattern sustained? • Self-propagating SF flocculant spirals • Kinematic spiral – stellar orbits not quite circular, eccentric pattern arranged in a particular order • Let stars in disk be on slightly eccentric paths • Guiding center moves uniformly at speed Ω(R) so that its azimuth • ϕgc = Ω(Rg)t • Oscillations in and out described by epicyclic motion guiding center R = Rg + x = Rg + X cos(κt + ψ)
Set stars with guiding centers spread around circle at Rg with ψ=2Φgc(0) stars lie on an oval with long axis at Φ=0. At later time = t, Φgc(t) = Φgc(0) + Ωt and stellar radii now R = Rg + X cos(κt + 2[Φgc(t) - Ωt]) R = Rg + X cos([2Ω-κ]t - 2Φgc(t)) • Long axis now points along direction where • (2Ω-κ)t – 2Φ = 0 or Φ = (Ω-κ/2)t Φ = Ωpt • where Ωp is the pattern speed • Pattern speed slower than stellar speed • Pattern of stars returns to original state after t=2π/Ωp • Star speeds allow them to return to original state after t=2π/Ω • Thus a 2-armed spiral can be made from a set of nested ovals of stars with different guiding center radii Rg • For an m-armed spiral, set ψ = mΦgc(0) and Ωp =Ω - κ/m
Note: Ωp varies with Rg and therefore the spiral pattern will also wind up with time, but slower than wind up due to stellar velocities. Ωp/Ω ~ 0.3 for flat rotation curve. • Density wave theory is based on the idea that mutual gravitational attraction of stars and gas clouds at different R can offset the spiral’s tendency to wind-up. • produces pattern which rotates rigidly within the galaxy disk.
How does the spiral pattern emerge? Something has to "seed" the perturbation (initial non-axisymmetry or galaxy encounters). Then self-gravity of the disk will amplify the perturbation and make it grow. http://burro.cwru.edu/Academics/Astr222/Galaxies/Spiral/spiral.html • Density inhomogeneities orbiting within disks. • Using high-resolution N-body simulations with mass concentrations similar to GMCs • Induces spiral arms through swing amplification • (D’Onghia et al. 2013)