Download
1 / 23
230 likes | 375 Vues
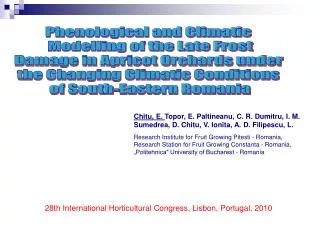
Phenological and Climatic Modelling of the Late Frost Damage in Apricot Orchards under the Changing Climatic Conditions of South-Eastern Romania. Chitu , E. Topor, E. Paltineanu , C. R. Dumitru, I. M. Sumedrea, D. Chitu, V. Ionita, A. D. Filipescu, L.

E N D
Phenological and Climatic Modelling of the Late Frost Damage in Apricot Orchards under the Changing Climatic Conditions of South-Eastern Romania Chitu, E.Topor, E. Paltineanu, C. R. Dumitru, I. M. Sumedrea, D. Chitu, V. Ionita, A. D. Filipescu, L. Research Institute for Fruit Growing Pitesti - Romania, Research Station for Fruit Growing Constanta - Romania, „Politehnica" University of Bucharest - Romania 28th International Horticultural Congress, Lisbon, Portugal, 2010
Due to the changes of continental-temperate climate of Romania, the late frosts affecting apricot trees by damaging flowers are happening more often Objectives • The purpose of this paper was to develop a simulation model that estimates not only the phenological dynamics until the end of blooming, but also to estimate the occurrence probability of climatic accidents caused by the late frosts in apricot orchards fromthe South-Eastern part of Romania during 1985 – 2008 period, under the climatic change conditions
MATERIAL AND METHODS • A database of phenological observationsconcerning the calyx red,first bloomand the end of petal fall (in the shuck), in apricot (‘Prunus armeniaca L.’), ‘Umberto’, ‘C.R. 2-63’, ‘Sirena’, ‘Neptun’ and ‘Selena’ cultivars orchards, for a 24 year period (1985-2008), was used. The orchards investigated were located within plain region of Constanta (Valu lui Traian), South-Eastern Romania, with trees of various ages. • Weather data: Mean, maximum and minimum daily temperatures from the February 1st to the May 31st,during 24-year period interval were taken into consideration.
The critical temperatures for the threephenophases, according to the literature (Julian et al., 2007; WSU EB1240), were: -4.0°C for calyx red – first bloom phenophase interval, -2.5°C for blooming and -2.0°C for in the shuck – green fruit interval. • In this study, probability was defined as the ratio between the number of years with unwanted events (floral organs damaged due to late frost) and the total number of years under surveillance. • This climatic accidents occur when both the phenophase and the critical temperature for this phenophase appeared simultaneously. • These non-mutually-exclusive events are described by the following formula (Hunt, 1986): • P (SE) = P (F) * P (T) (1) where: - P(SE) = the probability of the simultaneous occurrence of the two events, - P(F) = the probability of the phenophase occurrence, and - P(T) = the probability of the occurrence of temperatures equal to or lower than the critical temperatures during the same time period
The above equation is used when the simultaneous events outcomes (phenological dynamics and critical temperature)are independent; • There was nocorrelation between the onset of the three phenophases and the probability of occurrence of the critical minimum temperatures for the next 10-day period, after the phenophase onset
Because the events occur over a definite period of time, a 5-day time interval was selected using the available data; that means 24 years of phenological observations and about 120 daily minimum air temperature values for each 5-day period, measured over 24 years. • The daily minimum temperature data of each five-day interval between February 1st, 1985, and May 31st, 2008, were condensed into probability functions for which the assumption of normal distribution was validated by the Shapiro-Wilk statistical test (SPSS 14.0, USA). • These functions were used to calculate the probability of occurrence for temperatures lower than the phenophases critical values.
February through April period is considered of major importance for the onset of the fruit trees growing season (Chmielewski et al., 2004): Correlation between the length of the period from January 1st to the date of onset of the each phenophase (‘Umberto’ cv.) and the February through April mean air temperature
TEMPERATURE DYNAMICS According to the collected data at Constanta weather station, an trend of increase in mean, minimum and maximum air temperature for the February through Aprilmonthsduring the 1985 - 2008period, was noticed only on polynomial trendline regression. The was no statistically significant increase trend on linear regression.
FEBRUARY a) a) There was no an increase trend for all the maximum, minimum and mean temperatures during February (1985 – 2008) b) b) There was a trend of increase in standard deviation of daily maximum values of air temperaturein February (0.55°C per decade)
MARCH a) There was an increase trend for all the maximum, minimum and meantemperatures during March (1.55°C per decade for mean, 1.94°C for maximum and only 1.14°C for minimum temperature a) b) There was not a trend of increase in standard deviation of daily values of air temperatureduring March b)
a) APRIL a) There was no an increase trend for all the maximum, minimum and mean temperatures during April b) There was a trend of increase in standard deviation of daily minimum values of air temperaturein April (0.41°C per decade) b)
Trend of spring average temperature in Romania (°C) during 1961-2007. Confidence level minimum 95% for hatch areas
‘EMPIRICAL’ FREQUENCIES a) b) In order to check the hypothesis that the phenological data can be approximated by the normal distribution c) • The Shapiro-Wilk test value, T, • - Calyx red T= 0.964(P=0.627); • First bloomT=0.960 (P=0.549); • In the shuckT=0.970 (P=0.751). The hypothesis of normal data distribution could not be rejected Histograms of the onset of calyx red (a),first bloom (b) and end of petal fall (c) phenophases in the ‘Umberto’ apricot cultivar at Constanta (1985 - 2008).
PHENOLOGICAL DYNAMICS • ‘Umberto’ apricot tree cultivar used to have its onset of calyx redon April 12, 25 years ago. • Now it has its onset in vegetation on 26th of March (17 days earlier) Effect of the air temperature increasing trend was the earlier onset of apricot tree vegetation
Processing phenological data a) a) Time distribution of the phenophase stage frequency computed from onset dates of each successive phenophases: calyx red, first bloom and petal fall (1985-2008) b) b) Time distribution of the phenophase stage probability computed from mean date and standard deviation of each phenophase shown in frequency time distribution
MODEL OUTPUT From collected data we computed: a) probability of phenophase occurence, P(F); b) Probability of critical temperature occurence, P(T); Probability of two simultaneous events: P(SE)=P(F)*P(T).
a) • Time distribution of late frost damages in terms of phenophase stage frequency. ‘Umberto’ apricot cv. at Constanta (1985-2008) b) b) Time distribution of late frost damages in terms of phenophase stage probability. ‘Umberto’ apricot cv. at Constanta (1985-2008)
a) • To check if the trend of apricot earlier onset of vegetation may influence the late frost damage probability, we divided the 24 years interval into three periods of 8 years (1985-1992, 1993-2000, 2001-2008). • Simulation - 1985-1992; • Simulation - 2001-2008. b) The maximum sum of flower damages probability increased 7.6 times (11.4%).
Simulation model to predict apricot phenological stages • In order to apply this study conclusions, to the other regions from Romania, with no phenological observations (but with available temperature data), we developed a model to predict‘Umberto’ cv. phenological stages using the correlation between the hourly temperature sums and the phenological observations that were available for Constanta apricot orchards (1985-2008). • Sums of four temperature intervals, with different biological effect (≥ 2°C and < 8°C, ≥ 8°C and < 14°C, ≥ 14°C and < 20°C and ≥ 20°C), have been cummulated from February 1st to the date of phenophase estimation. There were taken into consideration five day intervals. • After the first five days, we made the first simulation with the equation (2) to compute the date of each phenophase onset: y = a + b1*x1 + b2*x2 + b3*x3 + b4*x4 (2) where: y = the number of days from January 1st to the onset of the phenophase, x1, 2, 3, 4 = the sum of hours with temperatures inside ≥ 2°C and < 8°C and the other above intervals; • We used the equation 2 for the onset of each of the three phenophases under surveillance; • We repet the computation for each other added five day intervals, and stop the simulation when the simulated date (y-days counted from January 1st) is very close to the date resulted from cumulating the five day intervals (starting with the 1st February); We considered February 1st as the starting date for calculating the sum of hours, because in January, in Romania, in all cases apricot trees are in the endodormancy period.
Model validation with Constanta orchard data The correlation between the recorded dates of onset of phenophases (y) and the simulated ones (x) is very highly significant
Craiova Simulation - 1985-1992; Simulation - 2001-2008. The maximum sum of flower damages probability increased 7.3 times (4.9%).
Conclusions • By thismethodone can be computed the dynamics of probability of late frost damage occurring in apricot orchards (‘Umberto’ and other 4 cultivars) at Constanta, South-Eastern Romania in the latest 25 years; • In the 1985 – 1992 period the maximum sum of flower damage probability was of only 1.5% (11-20 March) for ‘Umberto’. In this case, the area may be characterized as very favourable for growing apricot; • 16 years later (2001 – 2008) the maximum sum of flower damage probability increased 7.6 times (11.4%). In the 1-5 April interval once in 8.8 years apricot flowers were damaged by late frost. In this case, area may be described with high risk from this point of view.
Acknowledgment The work was carried out with the financial support of CNCIS, Program Idei, project 1035/2007.