Download
1 / 51
1.35k likes | 4.49k Vues
POTENTIAL OF RAINFED AGRICULTURE IN INDIA. International Water Management Institute & Central Research Institute for Dryland Agriculture (ICAR), Hyderabad. Estimated partitioning of the increased freshwater requirements between rainfed and irrigated agriculture.

E N D
POTENTIAL OF RAINFED AGRICULTURE IN INDIA International Water Management Institute & Central Research Institute for Dryland Agriculture (ICAR), Hyderabad
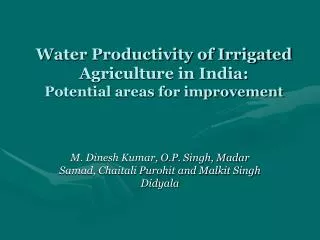
Estimated partitioning of the increased freshwater requirements between rainfed and irrigated agriculture
Global analysis of over 100 agricultural developmental projects found that yield levels in projects focused on improving rainfed agriculture has raised on average by 100%, often several hundred percent, while the comparable achievement in irrigated projects was a yield increase of only 10%. Under rainfed farming, operating at a lower yield level, every new investment results in a relatively higher and more equitable yield response.
Annual P, PET and moisture deficit index for different dryland stations of India
Rainfall partitioning in farming system in semi-arid tropics. Non-productive evaporation Half of the rainfall is generally “lost” to the atmosphere as non-productive evaporation.
Drylands of India • Erratic rainfall leading to frequent drought events • Degraded lands • Resource poor farmers • Small and marginal holdings • Lowering of groundwater table 25 dryland centres and 25 Agromet centres work on dryland technologies all over the country
Challenges of Rainfed Areas • Drought and water scarcity is a constant threat • Stubborn poverty & food insecurity • Low rainwater use efficiency, low cropproductivity & high instability • Land degradation & declining soil health • Acute fodder shortage and poor livestock productivity
Comparison of important characteristics of predominantly rainfed and irrigated regions of India
Distribution of rainfed crop based production systems in different rainfall zones
Seasonal and Annual Rainfall over India * Million hectare meters
Any region which has less than 30% irrigated area through major/ minor/ groundwater irrigation is considered to be as rainfed and the agriculture practiced is “Rainfed Agriculture” • Water management ranges from in-situ conservation to drainage and ex-situ water harvesting for supplemental irrigation • Watershed based water management is backbone for overall land productivity improvement • Rainfed Agriculture covers all the climates and several annual/ perennial crops; thus encompasses a range of agro-eco-regions • Contribution to food production 44% • Supports 40% of populationand 2/3 of livestock
India- Rainfed Region Irrigated area (> 30% irrigation) Rainfed area (< 30% irrigation )
Change in area, irrigation and productivity: Coarse Cereals 65.4 6.1% 0.59 0.98 1.04
Change in area, irrigation and productivity: Oilseeds 57.0 5.8% 0.52 0.82 0.87
Change in area, irrigation and productivity: Pulses 18.6 2.4% 0.59 0.60 0.50
Change in area, irrigation and productivity: Rice 4.86% 66.6 1.85 1.94 1.11
Early Drought Probability of consecutive 3 dry weeks from July 1st Week Probability (%)
Terminal Drought Probability of consecutive 3 dry weeks from September 2nd Week Probability (%)
Identification of Rainfed districts • Priority 1 • AESR 3-13 • Districts constituting top 85% area • Priority 2 • Districts with irrigation except canal irrigated (Future)
Selection Criteria No. of Districts Area under Sunflower (‘000 ha) Area under Rainfed Sunflower (‘000 ha) Gross Cropped Area (‘000 ha) Yield (kg/ha) Rainfed States (13) 224 1630 1246 120243 492 AESR 3-13 179 1406 1075 97692 531 Cumulative 85% Rainfed Sunflower Area 11 1143 902 12067 441 Delineation of Sunflower Districts State Name District Name Karnataka Bijapur,Gulbarga,Raichur,Dharwad Maharastra Ahmednagar,Solapur,Osmanabad,Beed,Parbhani,Nanded
Selection criteria No. of districts Area under Soybean (‘000 ha) Area under Rainfed Soybean (‘000 ha) Gross Cropped Area (‘000 ha) Yield (kg/ha) Rainfed states (13) 202 3666 3574 112689 532 AESR 3-13 160 3483 3391 90863 569 Cumulative 85% Rainfed Soybean Area 21 2857 2843 11217 911 Delineation of Rainfed Soybean Districts State Name District Name Madhya Pradesh Ujjain,Sehore,Mandsaur,Betul,Ratlam,Seoni,Narsinghpur,Vidisha,Shajapur, Hoshangabad, Dhar,Indore,Dewas,Chhindwara, Sagar, Guna, Raisen Maharastra Nagpur Rajasthan Jhalawar , Chittorgarh
Analysis of district/Sub-agro climatic region wise deficits of effective rainfall in meeting the water requirements of important crops at different time periods of crop growth. • Water balance analysis • Climatic water balance • Crop Water balance • FAO Crop water balance was carried out for each • district for dominant crops with dominant soil type and water holding capacity.
Not considered the spatial variability with in soil. Ideally, the model should be run for the crop covered area with underlying soil properties. • Constraint: Distribution of cropped area changes across the district during different years. • Sowing is supposed to be completed with normal onset of monsoon. Normal crop duration was assumed. • Results include crop wise and AESR wise surplus/deficit during the crop growing season. • FAO standard crop coefficients were used. • Surplus was estimated after deleting districts with surplus of 50mm and those districts with runoff less than 10% of rainfall. Assumption: The above surplus can reasonably utilised through in-situ moisture conservation practices.
Dominant districts for Sunflower 60 50 Gulbarga Bijapur 45 50 40 35 40 30 25 30 PPT/PE 20 20 15 10 10 5 0 0 1 4 7 1 4 7 10 13 16 19 22 25 28 31 34 37 10 13 16 19 22 25 28 31 34 37 40 43 46 49 52 week PPT PPT PE PE PPT/PE 40 43 46 49 52 week 35 50 45 30 40 25 35 20 30 PPT/PE/WR 25 PPT/PE/WR 15 20 10 15 Gulbarga PPT Bijapur 10 PPT 5 PE AWHC=150.00mm PE AWHC=150.00mm WR 5 WR 0 0 27 28 29 30 31 32 33 34 35 36 37 38 39 40 41 24 25 26 27 28 29 30 31 32 33 34 35 36 37 38 Week Week
Dominant districts for Cotton 70 80 Amaravathi Yeotmal 70 60 60 50 50 40 40 30 30 20 20 10 10 0 0 1 3 5 7 9 1 3 5 7 9 11 13 15 17 19 21 23 25 27 29 31 33 35 37 11 13 15 17 19 21 23 25 27 29 31 33 PPT PPT PE PE PPT/PE PPT/PE 39 41 43 45 47 49 51 35 37 39 41 43 45 47 49 51 week week 80 70 PPT PPT 70 PE PE 60 WR WR 60 50 50 40 PPT/PE/WR 40 PPT/PE/WR 30 30 20 20 Yeotmal AWHC=150.00mm Amravati 10 10 AWHC=150.00mm 0 0 22 23 24 25 26 27 28 29 30 31 32 33 34 35 36 37 38 39 40 41 42 43 44 45 46 47 23 24 25 26 27 28 29 30 31 32 33 34 35 36 37 38 39 40 41 42 43 44 45 46 47 48 Week Week
Drought Years • Case studies were carried out for few dominant districts of Andhra pradesh covering Rayalaseema, Telengana and Coastal Andhra regions. • Crop Water balance model was run for those dominant districts with predominant soil type for different years ranging from 1966 onwards. • Normal years and moderate drought years were separated based on IMD declaration for meteorological subdivision. Assumed that the those districts falling in that met divisions were all affected by drought. • Runoff was calculated for total crop season and for the period of SMW of 35-40 weeks which could be harvested for supplemental irrigation. • 2/3 of runoff during SMW 35-40 could be utilised for supplemental irrigation. • 85% application efficiency was considered.
Water Use is proportional to Yield • Difference in yield increase between drought to normal year is linearly proportional to difference in yield. • Incremental yield per mm of water is estimated. Based on runoff, harvestable runoff for supplemental irrigation is estimated and increase in production is also estimated.
During drought years production can be enhanced in medium to high rainfall areas with more certainity. Response from Medium to Deep soils would be higher. • During normal years, cropping intensity can be enhanced by provision of one irrigation at the time of sowing in rabi season. • Supplenmental irrigation can be given to low to medium deep soils in high to medium rainfall zones. • Stability of production can be ensured during normal years from shallow depth soils also.
IRS-P6 LISS-III data showing spatial distribution of COTTON crop in Nagpur district (Oct. 11, 2004) Area: 78000 ha
Yield gap analysis Crop : Cotton
Assessment of the response of other production inputs use such as fertilizer, high-yielding variety use of major rainfed crops Rain water harvesting and recycling – Farm pond - lined with local material
Improving the productivity of groundnut + pigeonpea intercropping system through supplemental irrigation – Anantapurin a drought year
Effect of different amounts of supplemental irrigation during drought stress at pod development stage of groundnut - Anantapur
Treatment Green leaf (kg/ha) Cured leaf (kg/ha) Bright leaf (kg/ha) Bright leaf (%) Grade index (kg/ha) T1 20 mm, one irrigation 6858 1110 474 42.70 849 T2 30 mm, one irrigation 7238 1213 517 42.62 937 T3 30 mm two irrigation (15 mm + 15 mm) 7254 1250 517 41.40 954 T4 40 mm one irrigation 7337 1238 529 42.70 962 T5 40 mm two irrigation (20 mm + 20 mm) 7664 1283 548 42.70 990 T6 control (no irrigation) 5477 942 374 40.23 709 SEM 240.69 65.72 33.60 52.20 CD at 5% 758.06 206.96 106.02 164.43 CV (%) 5.98 9.70 11.82 10.04 Supplemental irrigation improves Tobacco grade
Soil Water Conservation • Surplus Index Possible Options • <12 In-situ conservation (I) • 12-25 In-situ conservation (I) and Water Harvesting (WH) • >25 Drainage (D), In-situ conservation (I) and Water Harvesting • Crop Management Options • Yield Gap Possible Options • <33 Non monetary inputs (NMI) and improved varieties (V) • 33-66 Non monetary inputs (NMI), Fertilizer Management (F) and Improved Varieties (V) • >66 Improved Varieties (V), Fertilizer Management (F), Plant protection measures (PP), Non monetary inputs (NMI) or shifting alternate land uses
Viability of Water Harvesting in different Climatic Zones P/PET is ratio of Precipitation (rainfall) to Potential Evapo-Transpiration
Components of Rainwater Management in watershed Mode • In-situ conservation • Grade line Bund • Drainage line treatment • Water harvesting & utilization • Groundwater recharge
Potential of replacement of dryland crops with other high production/value crops and diversification of agriculture Intercropping system is stable with pigeonpea Figures in parentheses are years of on-farm trials in Operational Research Project