Understanding Correlation Coefficients: Interpreting Scatterplots and Relationships
This guide explores the concept of correlation, focusing on how to read scatterplots to evaluate the relationship between two variables, namely independent and dependent variables. Key examples include Mars rocks, AAVP data, and the correlation of SAT scores with essay length. We delve into the correlation coefficient (r), a numerical representation of linear association that ranges from -1 to 1, distinguishing positive from negative correlations. Additionally, we explain how to compute correlations using standard deviations and averages of both sets of data.

Understanding Correlation Coefficients: Interpreting Scatterplots and Relationships
E N D
Presentation Transcript
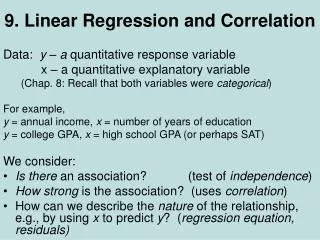
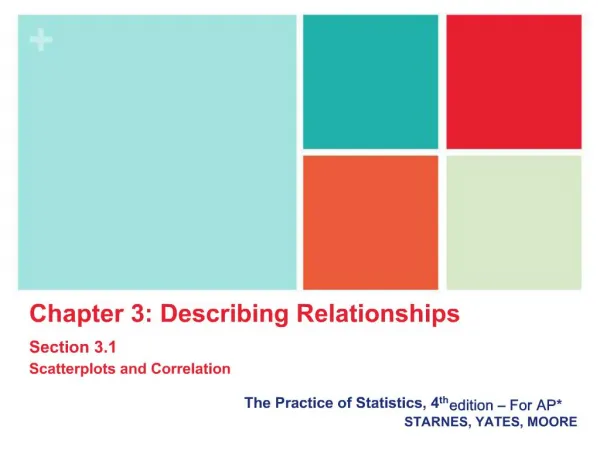
Ch. 8: Correlation • Reading a scatterplot – graphical interpretation of the relationship between 2 variables • Independent and dependent variables • Examples: • Mars rocks • AAVP data • SAT scores vs. essay length • Ex. A #6 p.124
Correlation Coefficient (r) • Measure of linear association (clustering, tightness) • The relationship between 2 variables can be summarized by: • Average of the x-values • SD of x-values • Average of the y-values • SD of the y-values • r
Correlation coefficients are always between -1 and 1. • A positive correlation vs. a negative correlation. • Standard Deviation Line: A line that goes through the point of averages and through all points which are an equal number of SDs away from the average, for both variables. • Slope =
Computing r • Convert each variable to standard units • Take the average of the products • Example: Ex. D #1(a)