Correlation, Energy Spectral Density and Power Spectral Density
1.07k likes | 3.64k Vues
Correlation, Energy Spectral Density and Power Spectral Density. Chapter 8. Introduction. Relationships between signals can be just as important as characteristics of individual signals

Correlation, Energy Spectral Density and Power Spectral Density
E N D
Presentation Transcript
Correlation, Energy Spectral Density and Power Spectral Density Chapter 8
Introduction • Relationships between signals can be just as important as characteristics of individual signals • The relationships between excitation and/or response signals in a system can indicate the nature of the system M. J. Roberts - All Rights Reserved. Edited by Dr. Robert Akl
Flow Velocity Measurement Heater Thermometer The relative timing of the two signals, p(t) and T(t), and the distance, d, between the heater and thermometer together determine the flow velocity. M. J. Roberts - All Rights Reserved. Edited by Dr. Robert Akl
Correlograms Signals Correlogram Two Highly Negatively Correlated DT Signals M. J. Roberts - All Rights Reserved. Edited by Dr. Robert Akl
Correlograms Signals Correlogram Two Uncorrelated CT Signals M. J. Roberts - All Rights Reserved. Edited by Dr. Robert Akl
Correlograms Signals Correlogram Two Partially Correlated DT Signals M. J. Roberts - All Rights Reserved. Edited by Dr. Robert Akl
Correlograms Signals Correlogram These two CT signals are not strongly correlated but would be if one were shifted in time the right amount M. J. Roberts - All Rights Reserved. Edited by Dr. Robert Akl
Correlograms DT Sinusoids With a Time Delay CT Sinusoids With a Time Delay Signals Signals Correlogram Correlogram M. J. Roberts - All Rights Reserved. Edited by Dr. Robert Akl
Correlograms Signals Correlogram Two Non-Linearly Related DT Signals M. J. Roberts - All Rights Reserved. Edited by Dr. Robert Akl
The Correlation Function Positively Correlated DT Sinusoids with Zero Mean Uncorrelated DT Sinusoids with Zero Mean Negatively Correlated DT Sinusoids with Zero Mean M. J. Roberts - All Rights Reserved. Edited by Dr. Robert Akl
The Correlation Function Positively Correlated Random CT Signals with Zero Mean Uncorrelated Random CT Signals with Zero Mean Negatively Correlated Random CT Signals with Zero Mean M. J. Roberts - All Rights Reserved. Edited by Dr. Robert Akl
The Correlation Function Positively Correlated CT Sinusoids with Non-zero Mean Uncorrelated CT Sinusoids with Non-zero Mean Negatively Correlated CT Sinusoids with Non-zero Mean M. J. Roberts - All Rights Reserved. Edited by Dr. Robert Akl
The Correlation Function Positively Correlated Random DT Signals with Non-zero Mean Uncorrelated Random DT Signals with Non-zero Mean Negatively Correlated Random DT Signals with Non-zero Mean M. J. Roberts - All Rights Reserved. Edited by Dr. Robert Akl
Correlation of Energy Signals The correlation between two energy signals, x and y, is the area under (for CT signals) or the sum of (for DT signals) the product of x and y. The correlation function between two energy signals, x and y, is the area under (CT) or the sum of (DT) their product as a function of how much y is shifted relative to x. or or M. J. Roberts - All Rights Reserved. Edited by Dr. Robert Akl
Correlation of Energy Signals The correlation function for two energy signals is very similar to the convolution of two energy signals. Therefore it is possible to use convolution to find the correlation function. It also follows that or or or M. J. Roberts - All Rights Reserved. Edited by Dr. Robert Akl
Correlation of Power Signals The correlation function between two power signals, x and y, is the average value of their product as a function of how much y is shifted relative to x. If the two signals are both periodic and their fundamental periods have a finite least common period, where T or N is any integer multiple of that least common period. or or M. J. Roberts - All Rights Reserved. Edited by Dr. Robert Akl
Correlation of Power Signals Correlation of periodic signals is very similar to periodic convolution where it is understood that the period of the periodic convolution is any integer multiple of the least common period of the two fundamental periods of x and y. or or M. J. Roberts - All Rights Reserved. Edited by Dr. Robert Akl
Correlation of Power Signals M. J. Roberts - All Rights Reserved. Edited by Dr. Robert Akl
Correlation of Sinusoids • The correlation function for two sinusoids of different frequencies is always zero. (pp. 588-589) M. J. Roberts - All Rights Reserved. Edited by Dr. Robert Akl
or or or Autocorrelation A very important special case of correlation is autocorrelation. Autocorrelation is the correlation of a function with a shifted version of itself. For energy signals, At a shift, t or m, of zero, which is the signal energy of the signal. For power signals, which is the average signal power of the signal. M. J. Roberts - All Rights Reserved. Edited by Dr. Robert Akl
or or Properties of Autocorrelation Autocorrelation is an even function. Autocorrelation magnitude can never be larger than it is at zero shift. If a signal is time shifted its autocorrelation does not change. The autocorrelation of a sum of sinusoids of different frequencies is the sum of the autocorrelations of the individual sinusoids. M. J. Roberts - All Rights Reserved. Edited by Dr. Robert Akl
Autocorrelation Examples Three different random DT signals and their autocorrelations. Notice that, even though the signals are different, their autocorrelations are quite similar, all peaking sharply at a shift of zero. M. J. Roberts - All Rights Reserved. Edited by Dr. Robert Akl
Autocorrelation Examples Autocorrelations for a cosine “burst” and a sine “burst”. Notice that they are almost (but not quite) identical. M. J. Roberts - All Rights Reserved. Edited by Dr. Robert Akl
Autocorrelation Examples M. J. Roberts - All Rights Reserved. Edited by Dr. Robert Akl
Matched Filters • A very useful technique for detecting the presence of a signal of a certain shape in the presence of noise is the matched filter. • The matched filter uses correlation to detect the signal so this filter is sometimes called a correlation filter • It is often used to detect 1’s and 0’s in a binary data stream M. J. Roberts - All Rights Reserved. Edited by Dr. Robert Akl
Matched Filters It has been shown that the optimal filter to detect a noisy signal is one whose impulse response is proportional to the time inverse of the signal. Here are some examples of waveshapes encoding 1’s and 0’s and the impulse responses of matched filters. M. J. Roberts - All Rights Reserved. Edited by Dr. Robert Akl
Matched Filters Noiseless Bits Noisy Bits Even in the presence of a large additive noise signal the matched filter indicates with a high response level the presence of a 1 and with a low response level the presence of a 0. Since the 1 and 0 are encoded as the negatives of each other, one matched filter optimally detects both. M. J. Roberts - All Rights Reserved. Edited by Dr. Robert Akl
Autocorrelation Examples Two familiar DT signal shapes and their autocorrelations. M. J. Roberts - All Rights Reserved. Edited by Dr. Robert Akl
Autocorrelation Examples Three random power signals with different frequency content and their autocorrelations. M. J. Roberts - All Rights Reserved. Edited by Dr. Robert Akl
Autocorrelation Examples Autocorrelation functions for a cosine and a sine. Notice that the autocorrelation functions are identical even though the signals are different. M. J. Roberts - All Rights Reserved. Edited by Dr. Robert Akl
Autocorrelation Examples • One way to simulate a random signal is with a summation of sinusoids of different frequencies and random phases • Since all the sinusoids have different frequencies the autocorrelation of the sum is simply the sum of the autocorrelations • Also, since a time shift (phase shift) does not affect the autocorrelation, when the phases are randomized the signals change, but not their autocorrelations M. J. Roberts - All Rights Reserved. Edited by Dr. Robert Akl
Autocorrelation Examples Let a random signal be described by Since all the sinusoids are at different frequencies, where is the autocorrelation of . M. J. Roberts - All Rights Reserved. Edited by Dr. Robert Akl
Autocorrelation Examples Four Different Random Signals with Identical Autocorrelations M. J. Roberts - All Rights Reserved. Edited by Dr. Robert Akl
Autocorrelation Examples Four Different Random Signals with Identical Autocorrelations M. J. Roberts - All Rights Reserved. Edited by Dr. Robert Akl
Autocorrelation Examples Four Different Random Signals with Identical Autocorrelations M. J. Roberts - All Rights Reserved. Edited by Dr. Robert Akl
Autocorrelation Examples Four Different Random Signals with Identical Autocorrelations M. J. Roberts - All Rights Reserved. Edited by Dr. Robert Akl
Cross Correlation Cross correlation is really just “correlation” in the cases in which the two signals being compared are different. The name is commonly used to distinguish it from autocorrelation. M. J. Roberts - All Rights Reserved. Edited by Dr. Robert Akl
Cross Correlation A comparison of x and y with y shifted for maximum correlation. M. J. Roberts - All Rights Reserved. Edited by Dr. Robert Akl
Cross Correlation Below, x and z are highly positively correlated and x and y are uncorrelated. All three signals have the same average signal power. The signal power of x+z is greater than the signal power of x+y. M. J. Roberts - All Rights Reserved. Edited by Dr. Robert Akl
Correlation and the Fourier Series Calculating Fourier series harmonic functions can be thought of as a process of correlation. Let Then the trigonometric CTFS harmonic functions are Also, let then the complex CTFS harmonic function is M. J. Roberts - All Rights Reserved. Edited by Dr. Robert Akl
or or Energy Spectral Density The total signal energy in an energy signal is The quantity, , or , is called the energy spectral density (ESD) of the signal, x and is conventionally given the symbol, Y. That is, It can be shown that if x is a real-valued signal that the ESD is even, non-negative and real. M. J. Roberts - All Rights Reserved. Edited by Dr. Robert Akl
or Energy Spectral Density Probably the most important fact about ESD is the relationship between the ESD of the excitation of an LTI system and the ESD of the response of the system. It can be shown (pp. 606-607) that they are related by M. J. Roberts - All Rights Reserved. Edited by Dr. Robert Akl
Energy Spectral Density M. J. Roberts - All Rights Reserved. Edited by Dr. Robert Akl
Energy Spectral Density It can be shown (pp. 607-608) that, for an energy signal, ESD and autocorrelation form a Fourier transform pair. or M. J. Roberts - All Rights Reserved. Edited by Dr. Robert Akl
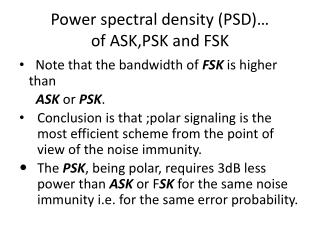
or or Power Spectral Density Power spectral density (PSD) applies to power signals in the same way that energy spectral density applies to energy signals. The PSD of a signal x is conventionally indicated by the notation, or . In an LTI system, Also, for a power signal, PSD and autocorrelation form a Fourier transform pair. M. J. Roberts - All Rights Reserved. Edited by Dr. Robert Akl
PSD Concept M. J. Roberts - All Rights Reserved. Edited by Dr. Robert Akl
Typical Signals in PSD Concept M. J. Roberts - All Rights Reserved. Edited by Dr. Robert Akl