Download
1 / 12
170 likes | 482 Vues
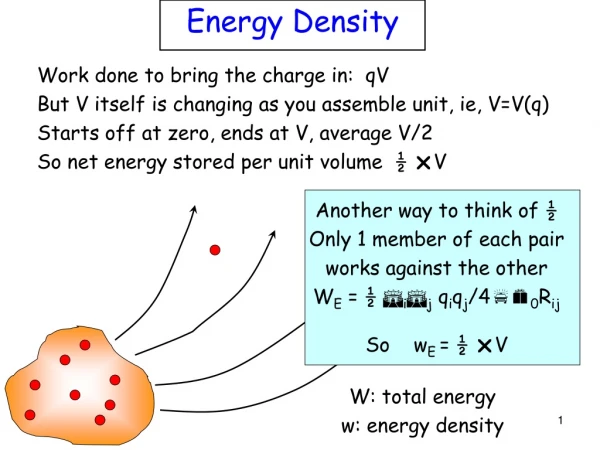
3F4 Power and Energy Spectral Density. Dr. I. J. Wassell. Power and Energy Spectral Density. The power spectral density (PSD) S x ( w ) for a signal is a measure of its power distribution as a function of frequency

E N D
3F4 Power and Energy Spectral Density Dr. I. J. Wassell
Power and Energy Spectral Density • The power spectral density (PSD) Sx(w) for a signal is a measure of its power distribution as a function of frequency • It is a useful concept which allows us to determine the bandwidth required of a transmission system • We will now present some basic results which will be employed later on
PSD • Consider a signal x(t) with Fourier Transform (FT) X(w) • We wish to find the energy and power distribution of x(t) as a function of frequency
Deterministic Signals • If x(t) is the voltage across a R=1W resistor, the instantaneous power is, • Thus the total energy in x(t) is, • From Parseval’s Theorem,
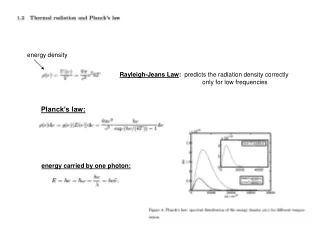
Deterministic Signals • So, Where E(2pf) is termed the Energy Density Spectrum (EDS), since the energy of x(t) in the range fo to fo+dfo is,
Deterministic Signals • For communications signals, the energy is effectively infinite (the signals are of unlimited duration), so we usually work with Power quantities • We find the average power by averaging over time Where xT(t) is the same as x(t), but truncated to zero outside the time window -T/2 to T/2 • Using Parseval as before we obtain,
Deterministic Signals Where Sx(w) is the Power Spectral Density (PSD)
PSD The power dissipated in the range fo to fo+dfo is, And Sx(.) has units Watts/Hz
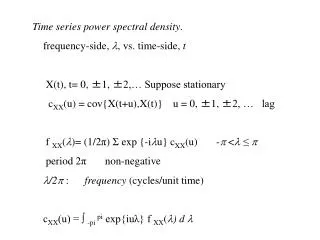
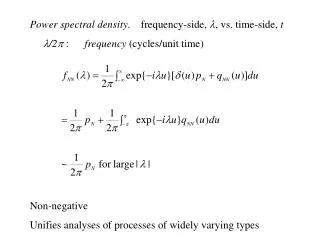
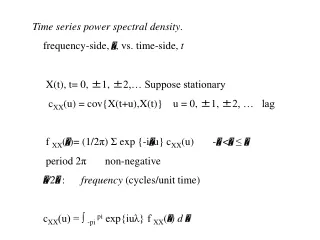
Wiener-Khintchine Theorem • It can be shown that the PSD is also given by the FT of the autocorrelation function (ACF), rxx(t), Where,
Random Signals • The previous results apply to deterministic signals • In general, we deal with random signals, eg the transmitted PAM signal is random because the symbols (ak) take values at random • Fortunately, our earlier results can be extended to cover random signals by the inclusion of an extra averaging or expectation step, over all possible values of the random signal x(t)
PSD, random signals • The W-K result holds for random signals, choosing for x(t) any randomly selected realisation of the signal Where E[.] is the expectation operator Note: Only applies for ergodic signals where the time averages are the same as the corresponding ensemble averages
Linear Systems and Power Spectra • Passing xT(t) through a linear filter H(w) gives the output spectrum, • Hence, the output PSD is,