Download
1 / 8
100 likes | 963 Vues
Proportion of Colors in a Box of Fruit Loops. Yael Egnal , John Kadavy , Megan Pottinger. Question and Data Collection. Is one color in a box of F ruit L oops more frequent than the others? Collected our data in class with one box of cereal

E N D
Proportion of Colors in a Box of Fruit Loops Yael Egnal, John Kadavy, Megan Pottinger
Question and Data Collection • Is one color in a box of Fruit Loops more frequent than the others? • Collected our data in class with one box of cereal • Chi-squared test for goodness of fit to see if there are equal proportions of each color • Problem encountered: only counted whole Fruit Loops
Hypotheses • Ho: The proportion of each color of Fruit Loops is equal • Ha: At least one of the proportions is different Errors • Type I: Claim the proportions are not equal when they are • Type II: Claim the proportions are equal but they are not • If the company is trying to make the proportion of colors all equal, then the type I error would be worse. Since neither error is detrimental, we used α-level of 5%
Conditions • Randomness: Assume factory randomly placed fruit loops into box. • Independence: Many boxes so assume our box’s data independent of other boxes. • Expected Counts›5: According to the table, all the expected counts are greater than 5.
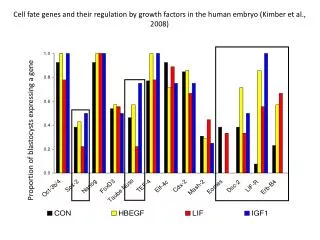
Data and Calculations χ² value = 21.216 + 46.301 + 1.326 + 19.795 + 1.5781 + 333.7 = 423.92 Degrees of freedom = 6 – 1 = 5 χ²cdf(423.92, 1000, 5) = 2.07x10-89 = p value (χ² value, large number, df)
Analysis and Conclusion • Since our p-value is much less than our α-level of 5%, we rejected the null hypothesis. Thus we have significant evidence that the proportion of colors in a box of Fruit Loops is not evenly distributed. • This was obvious since we could see that the proportion of green cereal pieces was much larger than any other color.
Lessons Learned • Proportions of colors are not equal, we can assume this for all boxes of Fruit Loops due to the fact that they were randomly packaged. New Questions • What is the true proportion of colors in a box of frootloops?