Download
1 / 27
270 likes | 292 Vues
Confidence Interval of a Proportion. FPP 20 - 21. Using the sample to learn about the box. Box models and CLT assume we know the contents of the box (the population). In real-world problems, we do not.

E N D
Confidence Interval of a Proportion FPP 20 - 21
Using the sample to learn about the box • Box models and CLT assume we know the contents of the box (the population). • In real-world problems, we do not. • In random samples, sample averages and percentages are good estimates of population quantities, but are subject to chance variation • We need a method of accounting for chance variation when trying to learn about the box.
Major Assumption • We did not cover chapter 20 much at all but in what follows we are assuming that the data come from a SIMPLE RANDOM SAMPLE. • None of what follows is valid if data is not collected this way. • If data not from a random sample there is little we can do • If data are from a random sample whose sampling scheme is more complicated than what we’ve learned in this class then computing standard errors is more complex.
Confidence intervals • Rather than a single estimate of a population quantity, we desire a range of likely values that takes chance error into account • We call the range of plausible values a confidence interval • The method of producing such intervals was developed by Jerzy Neyman in the 1920s
Confidence intervals • We will motivate confidence intervals using a variable that produces binary outcomes (categorical/qualitative) • Thus the parameter of interest is a proportion or percent • One of the tricky things about the rest of the semester will be to identify the parameter of interest in a given problem. • One good way of doing this is to identify the type of data being considered • Other parameters we will consider in the class are the mean, slope, difference of two means, etc..
Confidence intervals for population proportions/percentages • Let p be some population proportion. • Recall that the sample proportion has • EV = p and SE = • Why? • In large samples, we can use the normal curve to make probability statements about the sample proportion (CLT) • Example: In 95% of random samples, the sample proportion, p-hat, is within about 2 (more precisely 1.96 ) SEs of p
Mathematical derivation of the CI picture • If the sample size (n) is large enough, then by the CLT we know that for 95% of all samples the following is true. • In words, this is saying that 95% of all samples will produce a that falls in the range
Mathematical derivation • We can put p in the middle of the inequality, so that in 95% of random samples the following is true • In words, 95% of all samples will produce a that is within two SE’s (standard errors) from p (the population proportion/pecent) • Is this formulation useful? Why?
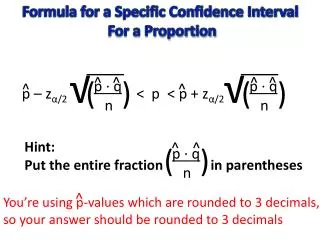
Confidence interval defined • Using the sample proportion from the data in the SE, we get • This is a 95% confidence interval for p
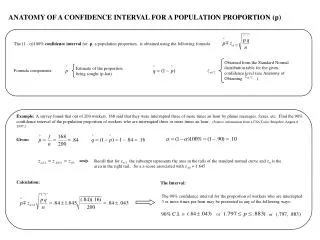
Application of CI • In 1998, New York Times and CBS News polled 1048 randomly selected 13-17 year olds to ask them if they had a TV in their room • In sample, 692 had a television in their room • Let p = proportion of 13-17 year olds in U.S. in 1998 who had a TV in their room.
Application of CI cont • Recall that • But we don’t know p. What do we do? Use p-hat • FPP refer to this as the boot-strap method • Thus • A 95% CI for p is • (0.660 – 1.96*0.01463, 0.660 + 1.96*0.01463) = (0.632, 0.689)
General form of all CIs • In what follows “est” means parameter estimate and “SE” means standard error • Lower limit = est. – (multiplier) * SE • Upper limit = est. + (multiplier) * SE • The multiplier determines the percent of samples that will produce a confidence interval that indeed contains the parameter • Question how do we find the multiplier?
Determining multiplier • For 95% confidence interval for p, the multiplier is the z-score value such that 95% of area under the standard normal curve falls between –z and +z • One can choose any level of confidence for the interval • 95% is most common, with 99% and 90% distance seconds • Example: multiplier for a 99% CI
Think about it • An increasing number of Americans are telling Gallup that drinking has been a problem in their family. As recently as 2005, the rate of self-reported problems was just 27%. However, this rose to 30% in 2009 and reached 36% in the most recent survey. The results that follow are based on telephone interviews with a randomly selected national sample of 1039 adults. With results based on samples of this size, one can say with 95 percent confidence that the error attributable to sample and other random effects could be plus or minus 3 percentage points • Is this true?
Interpretation of CI • The actual computation of confidence intervals is fairly straight forward. There are subtle difficulties associated with the interpretation • The interpretation of CI intervals needs three things • 1. Statement of parameter in words (with reference to the population) • 2. Statement of level of Confidence • 3. Statement of Interval
Correct Interpretations • “I am 90% confidence that the interval (0.5, 0.75) captures the true proportion of Duke alumni that donate” • “The interval (0.6, 0.99) gives a range of reasonable values for the proportion of all patients having flu like symptoms actually have the H1N1 virus. We are 95% confident of this.” • “The proportion of all seventh-grade girls whose IQ is between 95.3 and 109.2 is somewhere between 0.75 and 0.9 with 99% confidence.”
Incorrect Interpretations • “99% of IQ’s are contained in the interval (95.3, 109.2).” • “The probability that the interval (0.5, 0.75) captures the true proportion of Duke alumni that donate is .90” • “We are 95% confident that the interval (0.6, 0.99) contains the sample proportion of patients that have swine flu.” • “99% of the time, the proportion of seventh-grade girls with an IQ larger than 109.2 is contained in the interval (0.75, 0.91).” • “We are 90% confident that the interval (119.5, 128.1) captures the yields in bushels per acre.”
Statistical Confidence • What do we mean when we say we are 95% confident? • We are confident in the procedure that produced the interval • That is, we know that 95% of all simple random samples will produce a confidence interval that contains the value of the parameter • Note that there is NO PROBABILITY associated with CIs • Statistical confidence describes what will happen in the long run
Statistical confidence Cont. • We don’t know if our one sample produces one of the unlucky 5% CIs and doesn’t contain the value of the parameter • What does statistical confidence say about the chances of one particular interval containing the value of the parameter? • Nothing • Nada • Ziltz
Confidence intervals • Templates
Example of CI revisited • In 1998, the New York Times and CBS News polled 1048 randomly selected 13-17 year olds to ask them if they had a TV in their room. • In sample, 692 had a television in their room. • Let p = percentage of 13-17 year olds in U.S. in 1998 who had a TV in their room • A 95% CI for p is • (0.660 – 1.95*0.1463, 0.660 + 1.96*0.1463) = (0.632, 0.689) • We are 95% confident that the population percentage of 13-17 year olds in the U.S. in 1998 who had a TV in their room is between 0.632 and 0.689
Another example of CIs • Opinion polls often use the phrasing, • “85% of people think the economy is the number one issue. The poll has a margin of error of plus and minus 3%.” • This means that a 95% confidence interval stretches from 82% to 88%. • The margin of error in the confidence interval formula is • M.E. = multiplier*SE
Width of confidence interval • Width of CI depends on two quantities: • Multiplier • SE • Multiplier: determined by level of confidence • More confidence requires a ______________er multiplier and there for a ____________ CI
Width of confidence interval • Smaller SE implies a ________________ CI. • SE ____________ as n increases. • Therefore, increasing n ____________ width of CI • More (randomly sampled) data means _________ accurate inferences
True or false • DSG sets up a table outside the Bryan Center. DSG representatives at the table ask students to stop by and fill out a survey on a proposed activities fee increase. Out of the 100 people who complete the survey, 65 are in favor of the increase. The Chronicle reports that the percentage of Duke students who support an increase in the activities fee is likely between 55.5% and 74.5%.
Important caveat • Once again a confidence interval will NOT remedy a poorly designed study • Bad data yield unreliable (worthless) intervals