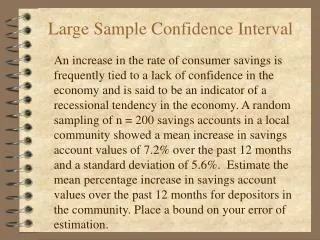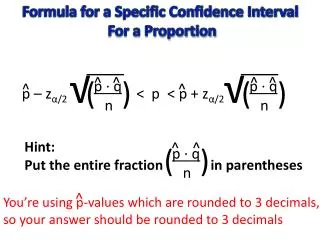
Estimating the Proportion of Red Marbles Using Confidence Intervals
This guide demonstrates how to estimate the population proportion of red marbles in a bowl containing marbles of three colors: red, green, and blue. By using a sample of marbles, we apply statistical methods to compute the sample proportion and standard deviation. We set a confidence level of 95%, utilizing a z-score to calculate the confidence interval for the true proportion of red marbles. We derive an interval of approximately [0.1703, 0.4296], indicating that we are 95% confident the true proportion of red marbles falls within this range.


Estimating the Proportion of Red Marbles Using Confidence Intervals
E N D
Presentation Transcript
A Three Color Bowl Suppose we have a bowl containing marbles, each identical in size, texture and weight, in three colors: Red, Green, Blue.
Proportion Red Suppose we have a large population containing marbles, each identical in size, texture and weight, in three colors: Red, Green, Blue. Suppose further that we wish to estimate the population proportion of red, but that examining the population directly and exhaustively is impractical.
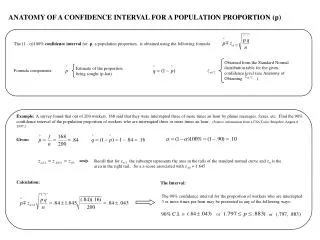
Sample Proportion Red nred = 15 n = 20 + 15 + 15 = 50 pred = 15 / n = 15 / 50 = .30 sdp = sqrt(p*(1-p)/n) = sqrt(.30*(1-p)/n) = sqrt(.30*.70/n) = sqrt(.30*.70/50) = sqrt(.210/50) ≈ sqrt(.0042) .06481
Our next step is to select a confidence level this number will provide a level of confidence in our estimation process. A standard choice is 95% confidence. Using the table @ http://www.mindspring.com/~cjalverson/ztable.htm, we obtain the following row: 2.00 0.022750 0.95450 Our multiplier is 2.00. Confidence Level
Lower Confidence Bound pred = .30 sdp .06481 Z = 2 lower bound = pred – Z*sdp = .30 – Z*sdp = .30 ─ 2*sdp ≈ .30 ─ 2*.06481 ≈ .30 ─ 2*.06481 ≈ .1703
Upper Confidence Bound pred = .30 sdp .06481 Z = 2 upper bound = pred + Z*sdp = .30 + Z*sdp = .30 +2*sdp ≈ .30 + 2*.06481 ≈ .30 + 2*.06481 ≈ .4296
Write the Interval We write the approximate interval as [.1703, .4296].
Confidence Estimation Schematic Compute lower = pred – Z*sdp upper = pred + Z*sdp Compute nred pred sdp Population Pred Obtain Sample Size = n
Interpretation ─ Population and Proportion We have a large population of marbles. We seek the true population proportion of red marbles for this population.
Interpretation ─ Family of Samples We obtain random samples of n=50 marbles per sample. Each marble is drawn from the population with replacement. Our Family of Samples consists of every possible random sample as described above.
Interpretation ─ Family of Intervals From each member of the Family of Samples we comupute the interval [pred─ 2*sdp, pred+ 2*sdp]; where pred = nred/n, and sdp=sqrt(pred*(1- pred)/n). Our Family of Intervals consists of every possible interval computed as above.
Interpretation ─ Confidence Approximately 95% of the members of the Family of Intervals cover Pred, the true population proportion of red marbles. The remaining 5% or so fail. We view our single interval, [.1703, .4296], as being drawn at random from the Family of Intervals. If our interval is drawn from the 95% supermajority, then between 17.03% and 42.96% of the marbles are red.