Download
1 / 57
570 likes | 595 Vues
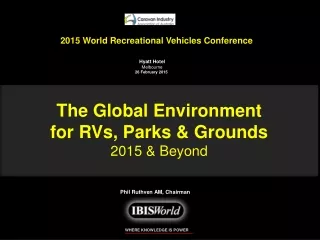
Join us at the World Recreational Vehicles Conference to gain invaluable knowledge on the global economic and social perspectives shaping the RV and parks industry in 2015 and beyond. Explore key success factors and trends in the ever-growing market. Phil Ruthven AM, Chairman, will guide you through the latest data and opportunities. Don't miss out on this exclusive event!

E N D
2015 World Recreational Vehicles Conference • Hyatt Hotel • Melbourne • 26 February 2015 The Global Environment for RVs, Parks & Grounds 2015 & Beyond Phil Ruthven AM, Chairman WHERE KNOWLEDGE IS POWER
Topics • Global Economic Perspective • Global Social Perspective • The Recreational Vehicle Market • The Recreational Parks Industry • Keys To Success
Global Perspective • In 2015 world population is expected to be 7.3 billion across 230 nations, sovereign states and principalities, living in an estimated 2.3 million dwellings • There is an estimated recreational vehicle park (caravans, camper trailers, motor homes etc) of over 100 million vehicles • Manufacturing of RVs is estimated to be around $US 38 billion in 2015. • Dealing (incl. used vehicles) is valued at an estimated $53 billion • Parks & Grounds are expected to earn $31 billion • Total employment across the market is estimated at almost 550,000 The RV data are first estimates only.
World GDP GrowthReal growth (PPP), 1950-2015(F) Purchasing Power Parity (PPP) terms 2012 3.0% 2013 3.1% (E) 2014 3.1% (F) 2015 3.3% (F) 1950-1969 growth in US$ market terms * The world decline in 2009 was -2.0% when measured in $US market price terms IMF/OECD/Economist//IBISWorld: 16/02/15
The World’s Economic Regions In 2014Share of World GDP (ppp basis) Eastern Europe 4.0% W&C Europe 18.3% North America 21.9% Indian S-C 7.3% ME 5.3% Asia Pacific 33.0% Africa 3.9% C&S America 6.3% 2014 World GDP, $US 92.5 trillion IMF/IBISWorld 09/02/14
Importance of World Regions GDP (ppp terms) 2014 Economy Population Africa Middle East % 4.0% 5.3% Africa 11.5% 6.6% N. America North America 21.9% M. East 4.1% Indian S/C 7.3% 6.9% C&S Amer. 6.6% W. Europe Indian S/C 23.1% 7.8% E. Europe Asia Pacific 33.0% 6.3%C&S America Western Europe 18.9% Asia Pacific 33.6% M. East 4.1% E. Europe 4.0% 7.2 billion $US ppp 92.5 trillion IBISWorld: 28/02/14
World Regions ImportanceChanging importance, % of World GDP (ppp terms) 1870 1913 1950 1998 2025 Year Nth America C & S America Western Europe Eastern Europe Middle East Africa Indian S-C Asia Pacific 3.6% 12.2% 7.6% 1.1 2.7 5.3 33.7 190.0 GDP (trillion) Source: OECD 20/02/13
Asia Pacific Economy2014 Singapore 1.3% Vietnam 1.3% NZ 0.5% Myanmar 0.4% Cambodia 0.1% Laos 0.1% PNG 0.1% Other 0.1% Philippines 1.7% Others 3.9% Thailand 2.6% Malaysia 1.9% Australia 3.9% Indonesia 4.9% 52.4%China *Korea*6.8% Japan 16.7% Taiwan HK 3.7% 1.5% *North Korea 0.2% South Korea 6.6% 25+ nations $US 30.5 trillion GDP (ppp terms) Wikipedia/IBISWorld 29/09/12
Asia Growth 2014 Major Asia Pacific and Indian S-C nations(ppp ranking) Regions Growth Asia 6.3% E. Europe 2.9% World (8 regions) 3.1% N. America 2.9% EU 1.0% Growth % (GDP) IMF/IBISWorld: 12/10/14
World’s 30 Largest Economies2015 (E) Poland 0.9% Argentina 0.9% Thailand 0.8% Thailands 0.8% Netherlands 0.8% S. Africa 0.7% Pakisthan 0.6% Egypt 0.6% Malaysia 0.6% Colombia 0.6% Purchasing Power Parity (PPP) terms Rest of World (200 nations) 15.0% 21 - 30th Nations 7.0% 19.0% USA 11th – 20th Nations14.4% 16.9% China Mexico France Russia Brazil India UK Germany 2.1% Japan 2.5% 2.6% 2.7% 5.9% 2.9% 3.6% 5.2% Italy 2.1% S. Korea 1.9% Canada 1.7% Spain 1.6% Indonesia 1.5% Turkey 1.4% Australia 1.1% 17th Iran 1.1% Saudi Arabia 1.1% Taiwan 1.1% World’s 230 nations US$ 97 trillion IMF/IBISWorld 05/01/15
Economic Growth: 2015(F)20 Largest Economies (ppp ranking) World Growth 2014 (F),3.3% Economist/IBISWorld 16/02/15
Government Net Debt 201320 Largest nations % of GDP Trouble Trouble Trouble Trouble Serious trouble Diabolical trouble Diabolical trouble Wikipedia: 12/08/13
Government Budget Balances: 201420 Largest Economies (% of GDP basis) The Economist/IBISWorld 05/01/15
Interest Rates10-year Bond Rate February 2015 The Econom ist 16/0215
Unemployment 2015Significant EconomiesMainly January Full employment <5% of labour force The Economist/IBISWorld 16/02/15
NZ Index of Consumer Sentiment2 months progressive toJanuary 2015 Recession Level Source: Roy Morgan Research IBIS estimates 15/02/15
China Index of Consumer Sentiment2 months progressive toDecember2014 Source: Trading Economics/IBISWorld 11/02/15
Australian Index of Consumer Sentiment2 months progressive toFebruary2015 Happy 66% of last 40 years 74% of last 20 years Recession Level Source: Westpac-Melbourne Institute (IAESR, IBIS estimates 12/02/15
USA Index of Consumer Sentiment2 months progressive toJanuary 2015 Happy 46% of last 33 years Recession Level Source: Conference Board Consumer Confidence Index January 2015
Canadian Index of Consumer Sentiment2 months progressive toDecember 2014 Happy 23% of last 31 years Recession Level Source: Conference Board Consumer Confidence Index. December 2014
UK Index of Consumer Sentiment2 months progressive toNovember 2014 Recession Level OECD EC Indicator 15/12/14
World’s 25 Largest Populations2013 Egypt 1.1% Iran 1.1% Turkey 1.0% Congo 0.9% Thailand 0.9% Rest of World (180 Nations) 13.1% 19.3% China 41st – 50th 3.9% 31st–405h Nations 5.2% 21st–305h Nations 7.4% 16th - 205h Nations 5.0% 17.5% India 11h - 155h Nations 6.9% USA Japan Bangladesh Russia Brazil Pakistan Nigeria 1.8% 2.0% 2.2% 4.5% 2.4% 2.8% 3.5% 2.6% Mexico 1.7% Philippines 1.4% Ethiopia 1.3% Vietnam 1.3% Germany 1.2% Indonesia World’s 230 nations 7.2 billion IBISWorld 22/08/13
World Religious Affiliation 2013 Religious Extremism Al Qaeda, Taliban Messianic Zionism Gush Emunim Mediaeval Crusades, Spanish Inquisituion, Klu Klux Klan Moral Majority Hindu Nationalism Includes: “none”, agnostics, secular humanists, atheists, etc Primal-indigenous* (incl. Africa) Other 2.6% 2.5% Chinese Traditional 5.6% Buddhism 7.3% Mainly Europe, America (N&S), S. Africa Hinduism 15.2% Mainly India Indonesia (most populous), Middle East, N. Africa, Central Asia Catholic, Protestant, AICs Eastern Orthodox, Pentecostal, Latter-Day Saints, Jehovah’s Witness, Nominal etc * Voodoo (Vodun) is the world’s oldest religion, around 6000BC 7.2 billion Source: Wikipedia
World Political Systems 2013 Others* 6% Communism 21.5% China Vietnam N. Korea Cuba Republic, parliamentary democracy, federations * Theocratic, monarchial, military, dictatorship etc Iran Iraq Syria Afghanistan Egypt Uzbekistan Cambodia Others 7.2 billion Source: CIA Factbook
Democracy In Practice? Democracy, in practice, is nowhere near 70% of the world population. A true and fair democracy is expensive. It requires a SOL of over $25,000/capita to ensure fair elections, an adequate and honest judiciary, and reasonably corrupt-free military and police forces via taxation. And within that level, it requires the tax capability to provide also a measure of egalitarianism via support to the unemployed, aged, sick and illiterate members of society: somewhere between $5-10,000 in taxes
Taxation In The Major Economies % of GDP basis2012 Nanny state” risk? OECD average World average Developing economies Total taxation & other revenue as a share of GDP Source: IBISWorld 06/03/14
Our Changing Society • Rise of virtual shopping • Living with ICT • The Internet/Information age • Increasing financial literacy • New entertainment & sports • Electronic “guardian angels” • Working differently • New industries/ occupations • Changing spirituality • Changing politics (ideologies) • Ecological sensitivity • Living longer • Average age rising • More generations co-existing • Smaller/different households • Moving to coast and equator • Changing ethnic mix • New tribalism (less local) • Fast rising incomes & wealth • Apartment living rising • More spending on services • Outsourcing tasks and chores
Living Longer And Working LongerLife Expectancy And The Retirement Age of Male Australians Who would want to be retired for 30+ years in 2100; and could the nation afford it? Rising Retirement Age Female life expectancy Rising Formal Education Source: ABS, Australian Historical Statistics, IBISWorld
Age Distribution 80+ 65+ 60-64 55-59 45-54 35-44 25-34 20-24 15-19 10-14 5-9 0-4 Australia 1866-2051 Source: ABS B Projections 16/02/15
So what is old these days? • At 65 years of age: • in 1800, you were dead 27 years ago. • in 1900, you were dead 12 years ago; • in 2000, you had 12-15 years to go; • In 2014, 65 is the new 45 of the 1930s; • in 2100, you may be only two-thirds through your life! • We need to be very careful about what an “ageing society” really means. • Even at 70 years of age many will still be working, probably part-time, and be fit and healthy. • One in four children born in 2001 are expected to live to a hundred; more if female. Life expectancy is increasing by 2-3 years per decade. • We need to keep raising the age definition of “old”
Our many Generations In F2014 Federation (90+ years) 0.7% Silents 72-89 years Gen Zers (<13 years) Baby Boomers 49-71 years 7.7% 16.5% “old fashioneds” “the thoughtfuls” 25.6% Net Generation (Y) 13-32 years 27.7% “spoilt rottens” 21.9% Generation X 33—48 years “free-rangers” “quiet achievers” Most powerful generations Generational Types Civics Adaptives Idealists Reactives Australia 23.6 million persons IBISWorld 30/06/14
Composition of Households in AustraliaBy household size, census years 1921-1996 and forecast to 2041 Persons per household
Work And Leisure Over Time Leisure Time Education Sleep Unpaid work Travel to work PaId work 46% 44% 43% 32% 29% 27% 23% 10.4% 12.4% 9.1% 23.7% 21.8% 19.8% 15.6% Year born
Increasing LeisureTimeHow various generations have spent, or will spend, their lifetimes 1788 1838 1888 1938 1988 2038 2088 Year born 23% 25% 29% 35% Leisure Time 38% 42% 46% Education Sleep Unpaid Work Travel to Work 23.7% 21.8% 19.8% 10.4% Paid Work 15.6% 12.4% 9.1% Life Expectancy (years) Source: IBISWorld
Changing Household Expenditure% of total basis 1900 1950 1960 1970 1980 1990 2000 2014 Non-durables Non-durables Taxes (direct) Health & Education Hospitality Entertainment/Recn Communications/fares Other services Rent Finance & Ins Serv Capital Related Savings $ billions
Manufacture of RVs(first estimates & forecasts) Revenue Growth1 Employment ($US billion) (Real, % pa) (‘000) USA 14.5 3.2 49.5 Canada 1.2 3.2 5.4 UK 0.8 1.8 3.1 Australia 1.6 1.0 7.6 17.1 3.1 65.6 Rest of OECD 17.7 67.8 Rest of World 3.2 13.6 Total 38.0 147.0 Note 1 : 5 years to F2020 Source: IBISWorld 16/02/15
Dealing in RVs(first estimates & forecasts) Revenue Growth1 Employment ($US billion) (Real, % pa) (‘000) USA 17.7 1.5 39.7 Canada 2.5 2.9 7.8 UK 1.5 2.3 11.4 Australia 1.7 1.8 10.2 23.4 1.7 69.1 Rest of OECD 24.2 66.8 Rest of World 5.4 15.1 Total 53.0 151.0 Note 1 : 5 years to F2020 Source: IBISWorld 16/02/15
RV Ownership • Just over 5% of the 9.3 million homes in Australia have caravans or other RVs • In the USA it is 10%. • In Europe it is 11% • Nearly one in 5 in the Netherlands has one So clearly some countries have more scope for RV ownership
RV Parks & Grounds(first estimates & forecasts) Revenue Growth1 Employment ($US billion) (Real, % pa) (‘000) USA 5.4 1.5 47.1 Canada 2.6 8.4 16.5 UK 4.0 0.2 34.1 Australia 1.3 1.5 10.2 13.3 2.5 107.9 Rest of OECD 13.7 111.5 Rest of World 3.4 27.9 Total 30.4 248.3 Note 1 : 5 years to F2020 Source: IBISWorld 16/02/15
Accommodation Styles(Australia 2013) Caravan Parks 10.1% 42.0% Hotels & Resorts Serviced Apartments 20.3% Motels 20.3% 7.3% Holiday Flats These ratios vary from country to country ABS/IBISWorld 06/05/13
What They Want • Good location • Large site • Outdoor space • Onsite ensuites • BBQ facilities • TV room • Swimming pool • Community kitchen • Games room • Linen hire Source: 2008 CRVA Research