WHERE KNOWLEDGE IS POWER
Sporting Future 2013 Melbourne Convention Centre 11 April 2013. Mega trends The Challenges and Opportunities Facing Sport in The Future. Phil Ruthven, Chairman. WHERE KNOWLEDGE IS POWER. Topics. 1. The Role Of Sport 2. Australia in the 21 st Century 3. Sport Participation

WHERE KNOWLEDGE IS POWER
E N D
Presentation Transcript
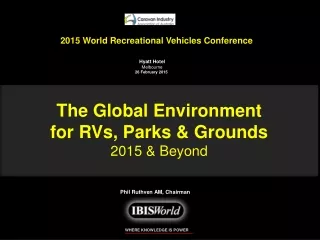
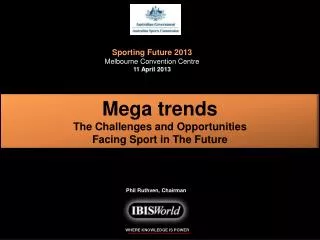
Sporting Future 2013 Melbourne Convention Centre 11 April 2013 Mega trends The Challenges and Opportunities Facing Sport in The Future Phil Ruthven, Chairman WHERE KNOWLEDGE IS POWER
Topics 1. The Role Of Sport 2. Australia in the 21st Century 3. Sport Participation 4. Money in Sport 5. Household Spending on Sport 6. So?
The Many Faces Of Sport • Sport encourages health and fitness • It builds relationships and team spirit • It can transcend race, religion, class and income • It nowadays transcends physical disabilities • It is an opportunity for philanthropy and volunteerism • It builds international understanding & friendships • It encourages competition (personal, inter-personal , inter-team) • It replaces wars and conflicts, with peace (as does trade) • It is fun in its many forms • It is an activity that can pick up the disadvantaged • For several hundred thousands it is a career & income
Sport is Big Business in Australia • Over 500, 000 participate in the inputs, activities (including volunteerism), socialising and derivatives(betting, media etc) of sport, over and above the direct participation of sportspeople, exercisers and spectators. • Revenue in 2012/13 is forecast to be $49.7 billion (or $66.3 billion with an imputed value for volunteerism).This will be 1.2% of the nation’s $4.3 trillion revenue and the value added contribution will be 2.0% of the nation’s $1.5 trillion GDP • Growth is forecast at around 2.7% pa over the 5 years to 2018-19
Some of the big players(revenue based) • Tabcorp $ 1.6 billion • Tatts Group $ 0.7 billion • WATAB $ 0.3 billion • AFL $ 0.5 billion • ASC $ 0.4 billion • Cricket Australia $ 0.2 billion • Tennis Australia <$ 0.2 billion • NRL <$ 0.2 billion
World’s 30 Largest Economies2012 (E) Argentina 0.9% Netherlands 0.9% Saudi Arabia 0.9% Thailand 0.8% S. Africa 0.7% Egypt 0.6% Pakistan 0.6% Colombia 0.6% Malaysia 0.6% Nigeria 0.5% Purchasing Power Parity (PPP) terms Rest of World (200 nations) 15.1% 21 - 30th Nations 7.1% 18.8% USA 11th – 20th Nations14.9% 15.4% China France Italy Russia India UK Brazil Japan Germany 2.2% 2.7% 2.8% 5.8% 2.9% 3.8% 3.0% 5.5% Mexico 2.1% S. Korea 2.0% Canada 1.7% Spain 1.7% Indonesia 1.5% Turkey 1.3% Australia 1.2% 17th Iran 1.2% Taiwan 1.1% Poland 1.0% World’s 228 nations US$ 82.8 trillion IMF/IBISWorld 23/08/12
Australian Index of Consumer Sentiment2 months progressive toMarch 2013 Happy 65% of last 40 years 73% of last 20 years Recession Level Source: Westpac-Melbourne Institute (IAESR), IBIS estimates 13/03/13
USA Index of Consumer Sentiment2 months progressive toMarch 2013 Happy 42% of last 33 years Recession Level Source: Conference Board Consumer Confidence Index 20.03.13
UK Index of Consumer Sentiment2 months progressive toFebruary 2012 Recession Level OECD EC Indicator 20.03.13
NZ Index of Consumer Sentiment2 months progressive toJanuary 2013 Recession Level Source: Roy Morgan ResearchIBIS estimates 22.01.13
The World’s Economic Regions In 2012Share of World GDP (ppp basis) Eastern Europe 4.0% W&C Europe 20.7% North America 22.5% Indian S-C 7.0% ME 5.5% Asia Pacific 29.7% Africa 4.0% C&S America 6.6% 2012 World GDP, $US 82.8 trillion IMF/IBISWorld 29/09/12
Global Change • As 2010 began: • the Asia Century had arrived (Asia Pacific + Indian subcontinent), supplanting the size of the USA that had supplanted the British Empire a century earlier • By 2016: • India has overtaken Japan’s economy (in 2012!); • China has overtaken the USA. • Brazil has overtaken the UK and French economies • Mexico and South Korea have overtaken Italy • Indonesia overtakes Australia (in 2012),Canada, Spain • By 2025, or earlier: • The Asia Pacific region is not only bigger than North America (USA, Canada, Mexico) and W&C Europe (mainly the EU) as it is already, but is bigger than both of them
Asia Pacific RegionGDPppp terms2012 Singapore 1.3% Vietnam 1.3% NZ 0.5% Myanmar 0.4% Cambodia 0.1% Laos 0.1% PNG 0.1% Other 0.1% Philippines 1.7% Others 3.9% Thailand 2.6% Malaysia 1.9% Australia 3.9% Indonesia 4.9% 50.4%China *Korea6.8% Japan 18.7% Taiwan HK 3.7% 1.5% *North Korea 0.2% South Korea 6.6% 25+ nations $US 24.6 trillion GDP (ppp terms) Wikipedia/IBISWorld 29/09/12
Australia’s Economic Growth Annual real GDP growth (%) progressed in quarters to December 2012(and forecast to September 2018) Average long business cycle is 34 quarters (81/2 years) Forecast 36 qtrs. 34 qtrs 34 qtrs 33 qtrs 38 qtrs 33 qtrs? 36 qtrs ? Years, ended June Source: IBISWorld: 08/03/13
Australia’s Standard Of Living GrowthGDP /capita @ F2011 constant prices 1788-2012 Hunting Age Agrarian Age Industrial Age Infotronics Age Enlightened Age Industrial Age Hunting, trapping, fishing, crafts, religion Agriculture Mining, Banking, Commerce Manufacturing, Construction and Utilities (electricity, gas & water) dominate Service industries and IC&T Imbedded intelligence, Neural network programs More electronic “guardian angels” New technologies SOL (2011 prices, $’000 Year, ended June IBISWorld 09/10/12
1800 1820 1840 1860 1880 1900 1920 1940 1960 1980 2000 2020 2050 Importance of Industries Shares of GDP by Industry Division,1800-2050 Agriculture Mining Manufacturing Utilities Construction W’Sale Trade Retail Trade Transport, Postal Media & Telecom Finance & Insurance Rental, Hiring. R Estate Dwelling O’Ship Prof & Tech Services Admin Services Public Admin/Safety Ind taxes less subsidies Education Hospitality Health & Social Assist Arts & Recreation Personal & Other Serv Primary Sector Secondary Sector Tertiary Sector Quaternary Sector Quinary Sector 1800 1820 1840 1860 1880 1900 1920 1940 1960 1980 2000 2020 2050
Our Changing Society • Rise of virtual shopping • Living with leisure • Living with ICT • Increasing knowledge • Increasing financial literacy • New entertainment & sports • Electronic “guardian angels” • Working differently • New industries/ occupations • Changing spirituality • Outlawing discrimination • Changing politics (ideologies) • Ecological sensitivity • Living longer • More living in coastal cities • More generations co-existing • Changing household structures • Smaller households • Changing ethnic mix (Eurasian) • New tribalism (less local) • A stabilisingdivorce rate • Fast rising incomes & wealth • Apartment living rising • Home leasing on the rise • More spending on services • Outsourcing tasks and chores
Australian Population1850-2051 Million 37.8 Forecasts (IBISWorld) 33.4 29.3 25.6 22.7 Year, ended June
Australia’s Broad Geographic Shift% of total 1901 2001 2051(F) 7% 19% Coastal Capital Cities Rural (cities >30,000 ) Rural(towns & shires) 25% 32% 64% 66% 61% 5% 12% 4% 5% Source: ABS & IBISWorld
Living Longer Life Expectancy And The Retirement Age of Male Australians Who would want to be retired for 30+ years in 2100; and could the nation afford it? Rising Retirement Age Female life expectancy Rising Formal Education Source: ABS, Australian Historical Statistics, IBISWorld
Australia’s Age Distribution1866-2051 80+ 65+ 60-64 55-59 45-54 35-44 25-34 20-24 15-19 10-14 5-9 0-4 Source: ABS B Projections 10/03/10
Our many Generations In F2012 Federation (>87 years) Silents 70-87 years Gen Zers (<11years) 1.2% 14.1% 8.0% “old fashioneds” Baby Boomers 47-69 years “the thoughtfuls” Net Generation (Y) 11-30 years 27.1% 27.4% “spoilt rottens” 22.2% “free-rangers” Generation X 31—46 years “quiet achievers” Generational Types Civics Adaptives Idealists Reactives 23.0 million persons IBISWorld 09/06/11
Work And Leisure Over Time Leisure Time Education Sleep Unpaid work Travel to work PaId work 46% 44% 43% 32% 29% 27% 23% 10.4% 12.4% 9.1% 21.8% 23.7% 15.6% 19.8% Year born
Australians’ TimeExpenditureAdults, working week Travel to work 1% Sleeping34.7% Child care Shopping Leisure & Recreation Education Eating & Drinking Other 1.7% 2.5% 1.3% 1.9% 5.4% 16.7% Hygiene & Health Care Volunteer work 0.8% Social Interaction IBISWorld 25/01/12
Sport & Physical Recreation ParticipationBy Age Group 79.1% 69.5% 68.7% 65.1% 64.2% 61.0% 48.2% Age cohort
Type of Activity (15+ aged Australians) Males Females Source: ABS 12/06/12
Important Participation TrendsCSIRO Sports Megatrends Report • Personalised sport for health and fitness • Market pressures and new business models • The rise of lifestyle sports • Economic growth and Asian sports development • Overseas health, community and aid objectives • Demographic, generational and cultural change
The Australian Sport MarketWithout volunteerism F 2013 (F) Supplies equipment manufacturing, construction Education Health Commerce: wholesaling retailing transport Sporting clubs Clubs (licensed) Racing (horses/dogs) Amusement parks Nature reserves Betting Media Conferences Derivatives 10.4% 45.3% Inputs Social30.0% 14.3% Sport Activity Facilities Administration Coaching Fitness Centres $49.7 billion (1.2% of nation’s $4.25 trillion revenue. Value added: 2.0% of GDP) Source: IBISWorld 04/04/13
Australian Sport Inputs Share of total basis F2013 (F) Sports Medicine Horse farming 4.0% Sports Education 2.7% 2.4% Sports Equipment Manufacture 2.7% 7.1% Boat Manufactg (and repairs) Sports Transport (Private) 14.2% 7.7% Recreation Construction 8.5% Wholesale Sports Equipment Sports Travel Fares 9.3% 18.7% Retail Sports Clothing 6.7% Retail Sports & Camping Equipment 13.3% Retail Marine Equipment 1.6% Revenue $ 22.5 billion IBISWorld 29/03/13
Australian Sport ActivityWithout Volunteers F 2013 (F) Facilities & Venues 24% Cricket 7.3% Golf 1.7% Ski Lifts 1.3% Other 2.4% 5.3% Football 3.7% Tennis 2.3% Indoor Administration 49.3% 18.3% Fitness Centres 70.0% Coaching Revenue $ 7.11 billion Source: IBISWorld 03/04/13
Australian Sport SocialisingF 2013 (F) Amusement Parks 4.1% Nature Reserves & Parks 12.0% Licensed Sporting Clubs Horse & Dog Racing 13.4% 51.1% 19.4% Sport Clubs Revenue $ 15.0 billion Source: IBISWorld 28/03/13
Australian Sport DerivativesF 2013 (F) Conferences/ Exhibitions 5.8% Print (news/mags) 16.1% TV (FTA & Pay) 11.8% Radio 2.3% Sports Media 30.2% 64.0% Sports Betting Revenue $ 5.2 billion Source: IBISWorld 28/03/13
The Australian Sport MarketF 2013 (F) Supplies equipment manufacturing, construction Education Health Commerce: wholesaling retailing transport Sporting clubs Clubs (licensed) Racing (horses/dogs) Amusement parks Nature reserves Betting Media Conferences Derivatives 7.8% 33.9% Inputs Social22.6% 35.7% Sport Activity 70% Volunteerism (imputed wages value) Facilities Administration Coaching Fitness Centres Volunteerism $66.3 billion (1.6% of nation’s $4.25 trillion revenue. Value added: 2.4% of GDP) Source: IBISWorld 02/04/13
Australian Sport ActivityF 2013 (F) Administration 14.8% Coaching 2.5% Fitness Centres5.5% Facilities7.2% 70.0% Volunteerism (imputed) Cricket 2.2% Football 1.6% Tennis 1.1% Indoor 0.7% Golf 0.5% Other 0.5% Ski Lifts 0.4% Revenue $ 23.7 billion Source: IBISWorld 28/03/13
Australian Household ExpenditureYear to December 2012 Depreciation 5.9% Dwell/ProptyInterest 5.3%Consumer Debt Int 0.8% Unincorp. Interest 0.6% Transfers 0.5% H’Hold durables 2.8% Motor vehicles 1.8%Other 0.7% Taxes (& social contributions) Savings 7.2% Capital Related 5.4%Durables 14.0% 13.1% Fin. & Ins. Serv. 7.6% 16.3%Non-durables Rent1 13.0% Health Hospitality Other Services Education Mobility 6.5% (& other dwelling costs) 3.9% 2.8% 2.3% 3.5% Entertainment (Gambling 3.4%) 4.4% Communicns. 1.5%Fares 2.0% Food 6.4% Alc.& Tobacco 2.2%Clothing 2.0% Utilities 1.7% Veh. Operation 3.0% Other 1.0% Note: 1 includes imputed rent (home ownership) $ 1287 billion ($143.000 per household) Source: ABS5206/IBISWorld
Changing Household Expenditure% of total basis 1900 1950 1960 1970 1980 1990 2000 2012 Taxes (direct) Non-durables Durables Health & Education Hospitality Entertainment/Recn Communications/fares Other services Rent Finance & Ins Serv Capital Related Savings $ billions
Household Outsourcing In The New Age1F2012 (E) Entertainment Recreation Gambling Clubs Other 2 2.4% Maintenance/Cleaning 3.5% Hair/beauty1.4% Child Care3.4% Entertainment & Recreation 28.3% Health Services 11.9% Financial 23.3% Services 11.0% Meals 12.7% Tourism Transport Accommodation Miscellaneous Legal Services 1.4% $292 billion$33,020 per Household ($633 per week) Note: 2 Baby sitting, Pre-school education M/V hire and maintenance, gardening and many others Note: 1Spending on services, new since 1965 Source: IBISWorld 09/10/12
Household Spending On Sport Share of Total (%), by Quintile,F2012(E) H’Hold Net Gross Total Sport Fitness Spectating Number Wealth Income Sport Eqpt. & Health Fees Richest Well Off Middle Struggle Poorest Source:IBISWorld 11/06/12
Some of the Challenges • As this Century unfolds, how do we maintain creativity in sporting products and their delivery? • How do we, incentivise and individualise sport to an increasingly ageing, sometimes indifferent and pluralistic society? • How do we reach the low income or otherwise disadvantaged segments of our society with adequate sport, exercise and fitness? • What should Australia’s role be in the Asia Pacific to promote sport and its individual, social and international benefits?
To download this presentation go to: www.ibisworld.com.au Ruthven ASC Enter details here to download presentation