Download
1 / 20
200 likes | 270 Vues
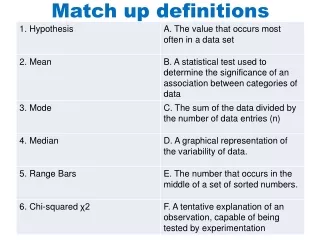
This task evaluates a student's investigation on mussel shell length variation on rocky shores, presenting data in a table and bar chart. It also explores Karl Pearson's Chi-squared test. Calculate χ2 value, compare with critical value, and make conclusions based on hypothesis testing. Ensure understanding of null hypothesis and statistical significance.

E N D
Evaluative Prep The aim of this Task is to evaluate an investigation on the number of spines on the leaves of European Holly.
Mussel shell length A student investigated the variation in the length of mussel shells on two locations on a rocky shore, the results are shown in the table below. • Plot the two mean length values on a bar chart • Add range bars to the bar chart • Indicate with a small cross the median value on the range bar
Graph skills Question – Using the table and the bar chart describe one similarity and one difference in the range of mussel lengths for both shores (3 marks)
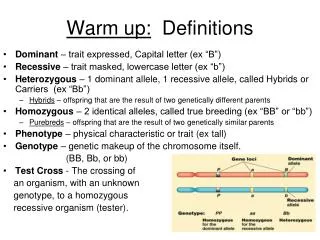
KARL PEARSON(1857-1936) British mathematician, ‘father’ of modern statistics and a pioneer of eugenics! (Pearson’s)
Chi-squared (χ 2) test • Chi-squared is used to test if the observed frequency fits the frequency you expected or predicted. • The theory is used to predict a result – this is called the expected result • The experiment is carried out and the actual result is recorded – this is called the observed result
What is the null hypothesis (H0)? To see if the results support the theory you make a hypothesis called the null hypothesis H0 = there is no statistically significant difference between the observed frequency and the expected frequency Your experimental result will always be a bit different but you need to know if the difference is just due to chance, or because the theory is wrong χ 2 is carried out and the outcome either supports or rejects the hypothesis
Calculating χ2 (O – E)2 χ2= E O = the observed results E = the expected (or predicted) results
You have been wandering about on a seashore and you have noticed that a small snail (the flat periwinkle) seems to live only on seaweeds of various kinds. You decide to investigate whether the animals prefer certain kinds of seaweed by counting numbers of animals on different species. You end up with the following data:Write a hypothesis for this investigation
How do we calculate the expected frequency? You might expect the observed frequency of your data to match a specific ratio. e.g. a 3:1 ratio of phenotypes in a genetic cross. Or you may predict a homogenous distribution of individuals in an environment. e.g. numbers of daisies counted in quadrats on a field. Total number of observed divided by the total of the ratios and then times by each ratio E.g. if 144 observed for 3:1 ratio: 144/4 = 36. 36x3=108 So: 3 = 108 and 1 = 36 Note: In some cases you might expect the observed frequencies to match the expected, in others you might hope for a difference between them.
Compare your calculated value of χ2 with the critical value in your stats table Our value of χ2 = 80.0 Degrees of freedom = no. of categories - 1 =
P Values • If the χ2 value is less than the P value at 0.05 (an arbitrary, but well accepted threshold), it means is that, any difference you observed is by chance • No significant difference between what we expected and what we actually got • This means we can accept the null hypothesis.
P Values • If the χ2 value is more than the P value at 0.05 (an arbitrary, but well accepted threshold), it means is that, any difference you observed is not just by chance • Significant difference between what we expected and what we actually got • This means we can’t accept the null hypothesis. • Something else must be affecting it Task: Complete your worksheet up to and including ‘making a conclusion’
Compare your calculated value of χ2 with the critical value in your stats table Our value of χ2 = 80.0 Degrees of freedom = no. of categories - 1 = 4 Our value for χ2exceeds the critical value at 5% (p = 0.05) probability level, so we reject the null hypothesis. There is a significant difference between our expected and observed results at the 5% level of probability. In doing this we are saying that the snails are not scattered about the various sorts of seaweed but seem to prefer living on certain species.
Task Question on sheet
Past Paper Question • F215 June 10