Download
1 / 50
500 likes | 652 Vues
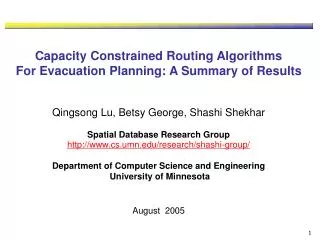
Capacity Constrained Routing Algorithms For Evacuation Planning: A Summary of Results Qingsong Lu, Betsy George, Shashi Shekhar Spatial Database Research Group http://www.cs.umn.edu/research/shashi-group/ Department of Computer Science and Engineering University of Minnesota August 2005.

E N D
Capacity Constrained Routing Algorithms For Evacuation Planning: A Summary of Results Qingsong Lu, Betsy George, Shashi Shekhar Spatial Database Research Group http://www.cs.umn.edu/research/shashi-group/ Department of Computer Science and Engineering University of Minnesota August 2005
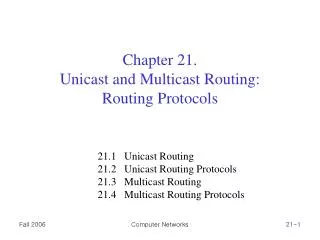
Introduction Motivation Problem Statement Related Works Contributions Conclusion and Future works Outline
Motivation – Nature Disaster Hurricane Andrew ( National Weather Services) Florida and Louisiana, 1992 • No effective evacuation planning • Traffic congestions on all highways • Great confusions and chaos "We packed up Morgan City residents to evacuate in the a.m. on the day that Andrew hit coastal Louisiana, but in early afternoon the majority came back home. The traffic was so bad that they couldn't get through Lafayette." Morgan City, Louisiana Mayor Tim Mott ( http://i49south.com/hurricane.htm ) Hurricane Andrew, 1992Traffic congestion ( www.washingtonpost.com) Hurricane Evacuation Route Sign in Florida
Motivation - Homeland Security • Preparation of response to a chem-bio attack • Plan evacuation routes and schedules after plume simulation • Guide affected population and public officials Base Map Weather Data Plume Dispersion Demographics Information Transportation Networks ( Images from www.fortune.com )
Given A transportation network, a directed graph G = ( N, E ) with Capacity constraint (non-negative integer) for each edge and node Travel time (non-negative integer) for each edge Number of evacuees and their initial locations (source nodes) Evacuation destinations (destination nodes) Output Evacuation plan consisting of a set of origin-destination routes and a scheduling of evacuees on each route. ( Route scheduling should observe capacity constraints of network ) Objective Minimize evacuation egress time (time from start of evacuation to last evacuee reaches destination) Minimize computational overhead Constraints Limited computer memory Problem Statement
A Simple Example – Building floor Map Two-story building: - Two staircases - Two exits on first floor ( Building floor map from EVACNET User Manual )
A Simple Example – Node and Edge Definition Nodes: Each room, hallway, staircase, etc. Edges: Each available link between two nodes.
A Simple Example - Initial State Max. Capacity = 50 • Each node has: • Maximum node capacity • ( max. number of people the node can hold) • Initial node occupancy • ( number of people at the node ) • Each edge has: • Maximum edge capacity • ( max. number of people can travel through this edge simultaneously ) • Edge Travel time • ( how long it takes to travel through this edge) Init. Occupancy =10 Max. Capacity = 50 Init. Occupancy = 5 Capacity=6 Travel time=3 Max. Capacity = 65 Init. Occupancy = 15
Example Input: Evacuation Network with Evacuees N1, 50 (10) Node Node ID, Max Capacity (Initial Occupancy) (7,1) N4, 8 (3,3) N3, 30 (3,3) N5, 6 (7,1) (3,4) (5,4) Edge N2, 50 (5) (Max Capacity, Travel time) N6, 10 N7, 8 N9, 25 (3,5) (5,5) (6,4) Destination node (14,4) (6,4) Node ID N11, 8 (8,1) (3,3) N13 N10, 30 (6,3) N8, 65 (15) Dest #1 (3,2) (6,4) N12, 18 (3,3) N14 Dest #2
Example Output : Evacuation Plan Example Evacuation Plan:
N1, 50 (10) Node Time: t = 16 15 7 13 12 11 10 9 14 6 5 4 3 8 2 1 0 D E F I Node ID, Max Capacity (Initial Occupancy) Animation: (3,3) (7,1) N5, 6 N4, 8 N3, 30 Edge (3,3) (5,4) (3,4) (7,1) (Max Capacity, Travel time) N6, 10 N2, 50 (5) N7, 8 H G Destination node (5,5) (3,5) Node ID N9, 25 (14,4) (6,4) (6,4) (6,3) (3,3) N13 N8, 65 (15) N10, 30 A N11, 8 C B (8,1) (3,2) Dest #1 N12, 18 (6,4) N14 (3,3) Dest #2
Related Works: Linear Programming Approach (1/3) Step 1: Convert evacuation network G into time-expanded network GT with user provided time upper bound T. G : evacuation network with n nodes ( n = 4 ) GT: time-expanded network ( T = 4 ) ( Source : H. Hamacher and S. Tjandra, “Mathematical Modeling of Evacuation Problems: A State of the Art”. Pedestrian and Evacuation Dynamics, pp. 227-266, 2002.) with N = n(T+1) nodes ( N = 20 )
Related Works: Linear Programming Approach (2/3) Step 2: Treat time-expanded network GT as a flow network and define the evacuation problem as a minimum cost flow problem on GT : (minimize total evacuation time of all evacuees) (initial occupancy at source nodes at time 0) (all evacuees reach destination nodes by time T) N: set of nodes, S: set of sources; D: set of destinations, qi: initial # of evacuees at source node i , xij(t) : flow from node i to j at time t , yi (t) : # of evacuees stay at node i at time t , ai : max. capacity of node i , bij : max. capacity of arc from node i to j . Step 3: Solve above problem using minimum cost flow solvers. e.g. NETFLO [Kennington and Helgason,1980], RELAX-IV [Bertsekas and Tseng, 1994].
Related Works: Linear Programming Approach (3/3) • Based on Triple Optimization Theorem [Jarvis and Ratliff, 1982]: Universal max. flow Min. cost flow Quickest flow • Example: • Hoppe and Tardos (Cornell, 1994): ellipsoid method, theoretically polynomial time bounded: O(N6), N = n(T+1), poor scalability to metropolitan road network. • EVACNET (U. of Florida, 1993): designed for building evacuation, use NETFLO. • Summary : • Produce optimal solution: minimize evacuation egress time. • Suitable for problem with moderate size network and require optimal solution • Limitations: • Require time-expanded network: Duplicate network for each time unit → large memory requirement Increased problem size: N = n(T+1)→ high computational complexity • Require user to estimated evacuation time upper bound T : Under-estimate → failure of finding a solution Over-estimate → unnecessary storage and run-time
Introduction Contributions Capacity Constrained Routing Planner (CCRP) Algorithm Design Decisions Cost Model Performance Evaluation Formulation of A* Search Algorithm Conclusion and Future works Outline
Main Contributions New heuristic algorithm (CCRP): • Develop new heuristic algorithm (CCRP) to find sub-optimal solution • Performance evaluation: • Reduce computational cost compared with optimal solution algorithm • High quality solution • Do not require user provided time upper bound • Provided upper bound of evacuation egress time for optimal solution algorithm New optimal solution algorithm (A* Search): • Designed and implemented A* Search algorithm for evacuation planning problem. • Proved admissibility and monotonicity of heuristic function. • Performance evaluation: • Produce optimal solution in all test cases. • Current implementation has exponential run-time and requires high memory usage. • Do not require user provided time upper bound
1. Model node capacity and edge capacity as a time series instead of a fixed number. Time series representation: For a given nodeNi: Available_Node_Capacity ( Ni , t ) =Available capacity of node Ni at time t For a given edgeNi -Nj: Available_Edge_Capacity ( Ni -Nj , t ) = Available capacity of edge Ni -Njat time t 2. Generalize shortest-path algorithm, e.g. Dijkstra’s algorithm, to account for capacity constraints Capacity Constrained Routing Approach Main ideas:
While (any source node has evacuees) do Step 1: Find route Rwith earliest destination arrival time among routes between all (source, destination) pairs, based on current available capacity of nodes and edges. Step 2: Compute actual flow amount on route R flow = min { number of evacuees left at source node of route R , Available_Edge_Capacity( all edges on R ), Available_Node_Capacity( all nodes on R ) } Step 3: Make reservation of capacity on route R Available capacity of each edge on R reduced by flow Available capacity of each incoming nodes on R reduced by flow New Heuristic Algorithm: Capacity Constrained Route Planner (CCRP) • Summary: • Each iteration generate route and schedule for one group of evacuee. • Produce sub-optimal solution. • Solution evacuation plan observes capacity constraints of network
Example Input: Evacuation Network with Evacuees N1, 50 (10) Node Node ID, Max Capacity (Initial Occupancy) (7,1) N4, 8 (3,3) N3, 30 (3,3) N5, 6 (7,1) (3,4) (5,4) Edge N2, 50 (5) (Max Capacity, Travel time) N6, 10 N7, 8 N9, 25 (3,5) (5,5) (6,4) Destination node (14,4) (6,4) Node ID N11, 8 (8,1) (3,3) N13 N10, 30 (6,3) N8, 65 (15) Dest #1 (3,2) (6,4) N12, 18 (3,3) N14 Dest #2
CCRP Execution Trace Quickest route between source/destination pair: Iteration: 1 R: (route with earliest destination arrival time) Node: N8 N10 N13 Start Time: 0 3 4 N1, 50 (10) Number. of Evacuees on Route R: 6 (7,1) Node: (3,3) (3,3) N4, 8 N3, 30 N5, 6 Node ID, Max Capacity (Initial Occupancy) (5,4) (7,1) (3,4) Edge: N2, 50 (5) (Max Capacity, Travel time) N6, 10 N7, 8 Edge reservation table: (14,4) N9, 25 (6,4) (5,5) (3,5) Each cell represents one time point (T0 - T15): (6,4) (6,3) (8,1) (3,3) N11, 8 N10, 30 N13 N8, 65 (15) e.g. Dest #1 (3,2) (6,4) N12, 18 Available edge capacity at time 3 is reduced to 5 N14 (3,3) Dest #2
CCRP Execution Trace Quickest route between source/destination pair: Iteration: 2 R: (route with earliest destination arrival time) Node: N8 N10 N13 Start Time: 1 4 5 N1, 50 (10) Number. of Evacuees on Route R: 6 (7,1) Node: (3,3) (3,3) N4, 8 N3, 30 N5, 6 Node ID, Max Capacity (Initial Occupancy) (5,4) (7,1) (3,4) Edge: N2, 50 (5) (Max Capacity, Travel time) N6, 10 N7, 8 Edge reservation table: (14,4) N9, 25 (6,4) (5,5) (3,5) Each cell represents one time point (T0 - T15): (6,4) (6,3) (8,1) (3,3) N11, 8 N10, 30 N13 N8, 65 (9) e.g. Dest #1 (3,2) (6,4) N12, 18 Available edge capacity at time 3 is reduced to 5 N14 (3,3) Dest #2
CCRP Execution Trace Quickest route between source/destination pair: Iteration: 3 R: (route with earliest destination arrival time) Node: N8 N11 N14 Start Time: 0 3 5 N1, 50 (10) Number. of Evacuees on Route R: 3 (7,1) Node: (3,3) (3,3) N4, 8 N3, 30 N5, 6 Node ID, Max Capacity (Initial Occupancy) (5,4) (7,1) (3,4) Edge: N2, 50 (5) (Max Capacity, Travel time) N6, 10 N7, 8 Edge reservation table: (14,4) N9, 25 (6,4) (5,5) (3,5) Each cell represents one time point (T0 - T15): (6,4) (3,3) (8,1) N11, 8 N10, 30 (6,3) N13 N8, 65 (3) e.g. Dest #1 (3,2) (6,4) N12, 18 Available edge capacity at time 3 is reduced to 5 N14 (3,3) Dest #2
CCRP Execution Trace Quickest route between source/destination pair: Iteration: 4 R: (route with earliest destination arrival time) Node: N8 N3 N4 N6 N10 N13 Start Time: 0 1 4 8 13 14 N1, 50 (10) Number. of Evacuees on Route R: 3 (7,1) (3,3) Node: N4, 8 (3,3) N5, 6 Node ID, Max Capacity (Initial Occupancy) N3, 30 (5,4) (3,4) Edge: (7,1) (Max Capacity, Travel time) N2, 50 (5) N7, 8 N6, 10 Edge reservation table: (14,4) N9, 25 (6,4) (5,5) (3,5) Each cell represents one time point (T0 - T15): (6,4) (3,3) N11, 8 (8,1) (6,3) N13 N10, 30 N8, 65 e.g. Dest #1 (3,2) (6,4) N12, 18 Available edge capacity at time 3 is reduced to 5 N14 (3,3) Dest #2
CCRP Execution Trace Quickest route between source/destination pair: Iteration: 5 R: (route with earliest destination arrival time) Node: N8 N3 N4 N6 N10 N13 Start Time: 0 2 5 9 14 15 N1, 50 (7) Number. of Evacuees on Route R: 3 (7,1) (3,3) Node: N4, 8 (3,3) N5, 6 Node ID, Max Capacity (Initial Occupancy) N3, 30 (5,4) (3,4) Edge: (7,1) (Max Capacity, Travel time) N2, 50 (5) N7, 8 N6, 10 Edge reservation table: (14,4) N9, 25 (6,4) (5,5) (3,5) Each cell represents one time point (T0 - T15): (6,4) (3,3) N11, 8 (8,1) (6,3) N13 N10, 30 N8, 65 e.g. Dest #1 (3,2) (6,4) N12, 18 Available edge capacity at time 3 is reduced to 5 N14 (3,3) Dest #2
Design Decision 1: Algorithm for Step 1 (1/2) Step 1: Finding route Ramong routes between all (source, destination) pairs. Three choices: 1. n x m single-source single-destination shortest path search: 1 per (Si , dj) pair. 2. n single-source all-destination shortest path search: 1 per source node. 3. One shortest path search: - Add super source node and super destination node to network. - One shortest path search from super source node to super destination node. G S1 d1 R S2 d2 dm Sn Sources Destinations Choice: one shortest path search Rationale: lower computational cost
Find Route R with one Shortest Path Search: Design Decision 1: Algorithm for Step 1 (2/2) Finding Route Ramong routes between all (source, destination) pairs: G S1 d1 (travel time, capacity) (travel time, capacity) (0,∞) R (0,∞) S0 S2 d2 d0 (0,∞) (0,∞) super source node super destination node (0,∞) (0,∞) dm Sn Sources Destinations If route < S0, Sx, …, dy, d0 > is the shortest route between S0 and d0, then < Sx, …, dy > must be the shortest route R between any (source, destination) pair.
Design Decision 2 – Choice of Shortest Path Algorithms Shortest path algorithm for graph with non-negative edge length: Three Choices: 1.Family of Dijkstra’s algorithm: Original Dijkstra’s algorithm: [Dijkstra, 1959]. Survey of implementations: [Cherkassky, Goldberg and Radzik, 1993]. 2. A* search algorithm for shortest path: [Nilsson, 1980], [Goldberg, 2004]. 3. Hierarchical routing algorithm: [Shekhar, 1997], [Rundensteiner, 1998], • Choice: Dijkstra’s algorithm • Rationale: • A* search: effectiveness of heuristic function deteriorate in later iterations of CCRP due to change of available capacity. • Hierarchical routing: pre-computed shortest path between partitions no longer hold in later iterations of CCRP due to change of available capacity.
Cost Model of CCRP Number of iterations:O(p) p : number of evacuees Each iteration generates one group of evacuees, Upper bound of number of groups = number of evacuees Cost for each iteration: ( n: number nodes, m: number of edges ) Step 1 - Find route Rwith one Dijkstra search: Dijkstra ( naïve implementation): O(n2) Dijkstra ( with heap structure): O(m+nlogn) for sparse graphs (e.g. road network) : m << nlogn Cost of Step 1: O(nlogn) Step 2 - Compute flow amount on route R : O(1) Step 3 - Make reservations on route R : O(n) Step 1 is dominant. CCRP cost model:O( p nlogn )
Performance Evaluation: Experiment Design Number of Nodes Number of Source Nodes Number of Evacuees Network Generator: NETGEN Estimated Evacuation Egress Time Limit T Evacuation network with capacity constraints and evacuees Network Transform Tool If no solution, increase T Capacity Constrained Route Planner (CCRP) T-time expanded evacuation network Minimum Cost Flow Solver: NETFLO Solution Run-time Solution Run-time Data Analysis Goal: 1. Compare CCRP with LP minimum cost flow solver (e.g. NETFLO): - Solution Quality: Evacuation egress time - Performance: Run-time 2. Test effect of independent parameters on solution quality and performance: - Number of evacuees, number of source nodes, size of network (number of nodes). Experiment Platform: CPU: Pentium 4 2GHz, RAM: 2GB, OS: Linux.
Performance Evaluation : Experiment Results 1 Experiment 1: Effect of Number of Evacuees Setup: fixed network size = 5000 nodes, fixed number of source nodes = 2000 nodes, number of evacuees from 5,000 to 50,000. Figure 1 Quality of solution Figure 2 Run-time • CCRP produces high quality solution, solution quality drops slightly as number of evacuees grows. • Run-time of CCRP is less than 1/3 that of NETFLO. • CCRP is scalable to the number of evacuees.
Performance Evaluation : Experiment Results 2 Experiment 2: Effect of Number of Source Nodes Setup: fixed network size = 5000 nodes, fixed number of evacuees = 5000, number of source nodes from 1,000 to 4,000. Figure 2 Run-time Figure 1 Quality of solution • CCRP produces high quality solution, solution quality not affected by number of source nodes. • Run-time of CCRP is less than half of NETFLO. • CCRP is scalable to the number of source nodes.
Performance Evaluation : Experiment Results 3 Experiment 3: Effect of Network Size Setup: fixed number of evacuees = 5000, fixed number of source nodes = 10 nodes, number of nodes from 50 to 50,000. Figure 2 Run-time Figure 1 Quality of solution • CCRP produces high quality solution, solution quality increases as network size grows. • Run-time of CCRP is scalable to network size.
A Real Scenario: Nuclear Power Plant Evacuation Route Planning Nuclear Power Plants in Minnesota Twin Cities
A Real Scenario: Monticello Emergency Planning Zone and Population Emergency Planning Zone (EPZ) is a 10-mile radius around the plant divided into sub areas. Monticello EPZ Subarea Population 2 4,675 5N 3,994 5E 9,645 5S 6,749 5W 2,236 10N 391 10E 1,785 10SE 1,390 10S 4,616 10SW 3,408 10W 2,354 10NW 707 Total 41,950 Estimate EPZ evacuation time: Summer/Winter(good weather): 3 hours, 30 minutesWinter (adverse weather): 5 hours, 40 minutes Data source: Minnesota DPS & DHS Web site: http://www.dps.state.mn.us http://www.dhs.state.mn.us
A Real Scenario: Transportation Road Map Monticello Power Plant Affected Cities Evacuation Destination University of Minnesota
A Real Scenario : New Plan Routes Experiment Result Total evacuation time: - Existing Plan: 268 min. - New Plan: 162 min. Monticello Power Plant Source cities Destination Routes used only by old plan Routes used only by result plan of capacity constrained routing Routes used by both plans Congestion is likely in old plan near evacuation destination due to capacity constraints. Our plan has richer routes near destination to reduce congestion and total evacuation time. Twin Cities
Summary of CCRP Algorithm • Capacity Constrained Route Planner (CCRP): • A heuristic algorithm that produce sub-optimal solution. • Experiment results show: • High quality solutions. • Scalable to number of evacuees and network size. • Lower run-time compared to linear programming algorithms. • Suitable for evacuation scenarios do not require optimal solution. • Do not require user provided evacuation time upper bound. • Output can be used as upper-bound for optimal evacuation egress time.
Introduction My Contributions Capacity Constrained Routing Planner (CCRP) Formulation of A* Search Algorithm Definition of search space Definition of heuristic function An example Performance evaluation Conclusion and Future works Outline
Definitions of A* Search Space: Start node: Initial state of evacuation network: all evacuees at source nodes Goal node : All evacuees at destination nodes Search space: Consists of different states of the evacuation network. Each search node is the snapshot of the network at one instant of time Expanding search node Given the occupancy (number of people at the node) of each source node and capacity constraints of outgoing edges of the node, all possible feasible combinations are generated. Cost function f( ) of each search node: f(n)= g(n) + h(n) g(n): actual cost from start node to n h(n) : estimated cost from n to goal node h(n) should be admissible: never over-estimate h(n) is admissible → A* returns optimal solution. Optimal Algorithm – A* search
Heuristic Function in A* Search Definition of cost function: f(n) of a search node n: f(n) = g(n) + h(n) g(n)= actual cost to reach n from the initial state. the depth of the search node n, which is the time instant that corresponds to the network state represented by n h(n)= estimated cost from n to reach goal state. maximum h() value of all groups in search node n. h()value of one group = shortest travel time to reach any destination, ignoring capacity constraints. Lemma 1: h( ) is admissible. h( ) never over-estimate the cost to reach goal state Lemma 2: h( ) monotonic.
A* Search - Example (1/2) (2, 1) 2 (2, 1) Initial state 1 4 2 T = 0 Node: (occupancy) 3 (2, 1) (2, 2) Edge: (capacity, travel time) f(n) = g(n) + h(n) = 0 + 2 = 2 2 (2, 1) 2 (2, 1) (2, 1) 2 (2, 1) T = 1 1 4 1 4 2 3 3 (2, 1) (2, 1) (2, 2) (2, 2) Next search node to be expanded f= g + h = 1 + 2 = 3 f=g + h = 1 + 1 = 2 1 1 (2, 1) 2 (2, 1) (2, 1) 2 (2, 1) (2, 1) 2 (2, 1) 1 1 1 4 1 4 1 4 1 1 3 3 3 (2, 1) (2, 1) (2, 1) (2, 2) (2, 2) (2, 2) f= g + h = 1 + 2 = 3 f= g + h = 1 + 2 = 3 f= g + h = 1 + 2 = 3
A* Search - Example (2/2) 2 (2, 1) 2 (2, 1) 1 4 T = 1 Next search node to be expanded 3 (2, 1) (2, 2) f=g + h = 1 + 1 = 2 1 T = 2 (2, 1) 2 (2, 1) (2, 1) 2 (2, 1) 2 1 1 4 1 4 3 3 (2, 1) (2, 1) (2, 2) (2, 2) f=g + h = 2 + 0 = 2 f=g + h = 2 + 1 = 3 Goal state Optimal solution
Performance Evaluation of A* Search: Experiment Design Number of Nodes Number of Source Nodes Number of Evacuees Network Generator: NETGEN Estimated Evacuation Egress Time Limit T Evacuation network with capacity constraints and evacuees Network Transform Tool If no solution, increase T A* Search for Evacuation Planning T-time expanded evacuation network Minimum Cost Flow Solver: NETFLO Solution Run-time Solution Run-time Data Analysis Goal: Compare A* Search algorithm with LP minimum cost flow solver (NETFLO): 1. Solution Quality: - Does A* algorithm produce optimal solution (same evacuation time as of NETFLO) ? 2. Performance: - How does the A* algorithm run-time compared with that of NETFLO ? Experiment Platform: CPU: Pentium 4 2GHz, RAM: 2GB, OS: Linux.
Performance Evaluation of A* Search: Experiment Results Experiment: Compare solution and run-time of A* Search and NETFLO. Varying network size: from 10 to 40 nodes. Figure: Run-time of A* Search and NETFLO • Solution Quality: • A* search produces optimal solution (same evacuation time as NETFLO) in all test cases. • Performance: • Run-time of A* search is exponential to the network size. • Current implementation of A* search has higher run-time than that of NETFLO.
Summary of A* Search Formulation • A* Search for evacuation route planning: • Produce optimal solution. • Do not need user provided time upper bound. • Heuristic function is admissible and monotonic. • Experiment results show that run-time is exponential to the size of the network. • Current implementation requires high memory usage.
Conclusions New heuristic algorithm (CCRP): • Developed new heuristic algorithm (CCRP) to find sub-optimal solution. • Performance evaluation: • Reduce computational cost compared with optimal solution algorithm • High quality solution • Do not require user provided time upper bound. • Provided upper bound of evacuation egress time for optimal solution algorithm. New optimal solution algorithm (A* Search): • Designed and implemented A* Search algorithm for evacuation planning problem. • Proved admissibility and monotonicity of heuristic function. • Performance evaluation: • Produce optimal solution in all test cases. • Current implementation has exponential run-time and requires high memory usage. • Do not require user provided time upper bound
Future Works (1/2) • CCRP Algorithm: • Effect of using different shortest path algorithms in Step 1 of CCRP: • Different Implementations of Dijkstra’s algorithm: • e.g. Binary heap, Fibonacci heap, Double-bucket, etc. • A* search for shortest path • Assumptions: • Edge travel time observe FIFO (First-In First-Out) property. • Constant maximum capacity for nodes and edges. • Constant edge travel time. • Effect of allowing time-varying edge capacity and travel time.
Future Works (2/2) • A* Search Algorithm: • Performance tuning of current A* implementation: • Improve algorithm run-time: • e.g. pruning in search node expansion. • Explore new data structures to reduce memory usage • Analysis of cost model of A* search • Related Problem: • Contra-flow problem: • New algorithm to find optimal network configuration to reduce evacuation time.
Thank you ! Questions and Comments ?