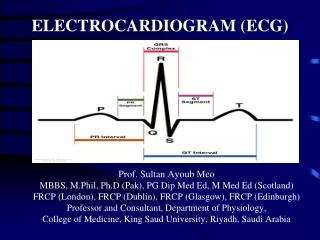
Electrocardiogram ECG III
Electrocardiogram ECG III. ANALYSIS Dr. Amel Eassawi. Abnormal ECG waves are important in recognizing and assessing cardiac myopathies (damage of the heart muscle) Myocardial ischemia: Inadequate delivery of oxygenated blood to heart tissue. Necrosis: Death of heart muscle cells.

Electrocardiogram ECG III
E N D
Presentation Transcript
Electrocardiogram ECG III ANALYSIS Dr. AmelEassawi
Abnormal ECG waves are important in recognizing and assessing cardiac myopathies (damage of the heart muscle) • Myocardial ischemia: • Inadequate delivery of oxygenated blood to heart tissue. • Necrosis: • Death of heart muscle cells. • Acute myocardial infarction (heart attack) • Occurs when blood vessel supplying area of heart becomes blocked or ruptured. Cardiac Myopathies
Myocardial infarction is the result of severe hypoxia of an area of the cardiac muscle. There are three different areas identifiable in a myocardial infarction: • (1) the area most severely damaged (necrosis) heals with a scar of connective tissue. • (2) This area is usually surrounded by an area of injury where the damage is less severe. • (3) Between the area of injury and the normal muscle there is an ischaemic area. Myocardial Infarction
Myocardial Infarction Ischaemia alters only repolarization and results in abnormal T waves, typically negative, in the leads facing the ischaemia. Injury results in a shift of the ST segment. Necrosis is a dead tissue. The lead facing the necrotic area does not record any activity.If the necrosis is transmural, it will record the activation of the opposing wall and therefore records the tails of the wave front of that wall, which does not give rise to R wave but abnormal Q or QS waves.
Elevation of the ST segment (greater than 1 small box) in 2 leads is consistent with a myocardial infarction.
Injury Current Injury results in the presence of an injury current .During diastole, the injury area is more depolarized than the normal muscle, which creates an electrical gradient from the area of injury towards the normal tissue. During systole, the normal tissue depolarizes better than the injured area and therefore creates an electrical gradient from the normal tissue towards the ischaemic area. This electrical gradient produces an injury current that results in a shift of the ST segment. From the magnitude and direction of the ST shift in different Leads we can generally determine the site of the infarction in the heart.
Septal MI V1 V2
Anterior & lateral wall MI I aVL V2 V3 V4 V5 V6
Inferior wall MI II III aVF
Hyperkalemia • Hyperkalemia: Increase in the extracellular potassium concentration due to reduction in blood flow (ischemia) could be the result of: • Reduced ATP supply leading to reduction in the NA,K-ATPase pump activity. • Limited disposal of extracellular fluid by-products Hyperkalemia causes an increase in potassium conductance (gK), which enhance phase 3 of the action potential (repolarization) and therefore shortens the action potential duration. This enhanced repolarization is reflected as a tall tent-shaped T wave in the electrocardiogram, a common sign of hyperkalemia. NORMAL HYPERKALEMIA HYPOKALEMIA
ABNORMALP WAVE Pmitrale P pulmonale • P wave: inverted.Thisindicates depolarization of the atria in an unusual direction. The pacemaker is not in the sinus node, but is situated either elsewhere in the atrium, in the AV node or below this; or there is dextrocardia. • P mitrale: broadened and notched, due to delayed depolarization of the left atrium when the left atrium is enlarged. • P pulmonale: tall and peaked, exceeding 3 mm, as a result of right atrialenlargement. • P wave absent or invisible: due to the presence of junctional rhythm or sinoatrialblock replaced by flutter or fibrillation waves.
NORMAL AND ABNORMAL ST SEGMENTS AND T WAVES Normal ST segment with J point (B) Horizontal ST depression in myocardial ischaemia (C) ST segment sloping upwards in sinus tachycardia (D) ST sagging in digitalis therapy (E) Asymmetrical T wave inversion associated with ventricular hypertrophy. (F) Similar pattern sometimes seen without voltage changes in hypertrophy – ‘strain’.
NORMAL AND ABNORMAL ST SEGMENTS AND T WAVES (G) ST sagging and prominent U waves of hypokalaemia. (H) Symmetrically inverted T wave of myocardial ischaemia or infarction. ST elevation in acute myocardial infarction. (J) ST elevation in acute pericarditis. (K) Peaked T wave in hyperkalaemia.
Left Ventricular hypertrophy • Etiology: • mitral valve disease • aortic valve disease • systemic hypertension • ECG Characteristics: • leads V1 and V2: tall S-wave • leads V5 and V6: tall R-wave.
Right Ventricular hypertrophy • Etiology: • pulmonary valve stenosis • tricuspid insufficiency • pulmonary hypertension • many congenital cardiac abnormalities, such as a ventricular septal defect • ECG Characteristics: • leads V1 and V3: tall R wave • leads V5 and V6: tall S wave
Human physiology, Lauralee Sherwood, seventh edition. Text book of medical physiology by Guyton & Hall 11th edition The ECG made Easy by John R.Hampton sixth edition Physiology by Berne and Levy, sixth edition References