ELECTROCARDIOGRAM (ECG)
ELECTROCARDIOGRAM (ECG). بسم الله الرحمن الرحيم. Cardiovascular System Physiology Lab Interpretation Dr.Mohammed Sharique Ahmed Quadri Asst. professor in physiology. P wave : upright except in avR Normal duration: 0.08 to 0.11 sec do you see p waves ?

ELECTROCARDIOGRAM (ECG)
E N D
Presentation Transcript
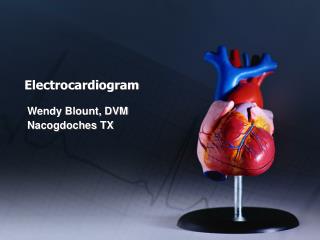
ELECTROCARDIOGRAM (ECG) بسم الله الرحمن الرحيم Cardiovascular System Physiology Lab Interpretation Dr.MohammedSharique Ahmed Quadri Asst. professor in physiology
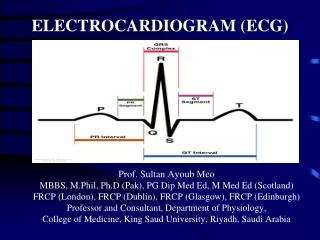
P wave : upright except in avR Normal duration: 0.08 to 0.11 sec do you see p waves ? are all p waves same ? does all QRS complexes have p waves ? • P-R interval : Normal range 0.12 – 0.20 sec Is the PR interval constant ? If prolong indicates various blocks Analyzing individual waves & segments
QRS complexes: • Are the p waves & QRS complexes are associates with each other • Are the QRS complexes narrow or wide • ST Segment : • Normal : Isoelectric • Elevation : in acute MI • Depression : in ischemia • T wave: • Tall T wave : ischemia, hyperkalemia • Inverted : young children ,deep inspiration, bundle branch block, ischemia,hypokalemia Analyzing individual waves & segments
QT INTERVAL: • 0.4 to 0.43 seconds depending upon heart rate. • At high heart rates, ventricular action potentials shorten in duration, which decreases the Q-T interval. • . prolonged in acute MI ,hypocalcaemia Analyzing individual waves & segments
ST Elevation One way to diagnose an acute MI is to look for elevation of the ST segment.
ST Elevation (cont) Elevation of the ST segment (greater than 1 small box) in 2 leads is consistent with a myocardial infarction.
Putting it all Together Do you think this person is having a myocardial infarction. If so, where? Yes, this person is having an acute anterior wall myocardial infarction.
Now, where do you think this person is having a myocardial infarction? Inferior wall MI
How about now? Anterior & lateral wall MI
NORMAL HYPERKALEMIA HYPOKALEMIA
INTERPRETE THE ECG ? HYPERKALEMIA Observe Tall T - wave
This ecg shows • Sinus rhythm • Heart rate of 75/ min • Normal QRS axis • Normal PR interval 0.12 sec • Normal QRS duration 0.8 sec • ST segment isoelectric in all leads • T wave normal & upright in all wave except in aVR Reporting of ECG
Text book of medical physiology by GUYTON & HALL 11 th edition Text book physiology by GANONG The ECG made Easy by John R.Hampton sixth edition The guide to EKGinterpretation by JohnA.Brose, D.O,John C.Auseon references
Prof. Magdy El-Barbary Question NO: Suggestive of What is the most likely cause of changes in ST seg. & T wave of each diagram?
ST elevation & depression T-waves peaked flattened inverted Appearance of pathologic Q-waves ECG Changes Ways the ECG can change include:
Text book of medical physiology by GUYTON & HALL 11 th edition Text book physiology by GANONG The ECG made Easy by John R.Hampton sixth edition The guide to EKGinterpretation by JohnA.Brose, D.O,John C.Auseon References