Download
1 / 37
480 likes | 920 Vues
Electrocardiogram. Dr. Thouraya Said. Contents. ECG paper. ECG leads: Limb leads. Chest leads. Interpretation of the ECG. Cardiac axis Heart rhythm. Heart rate. ECG records the electrical changes (depolarization and repolarization) that take place in the heart/per cycle.

E N D
Electrocardiogram Dr. Thouraya Said
Contents • ECGpaper. • ECGleads: • Limbleads. • Chestleads. • Interpretation of theECG. • Cardiacaxis • Heartrhythm. • Heartrate.
ECG records the electrical changes (depolarization and repolarization) that take place in the heart/percycle. • These changes can be detected byelectrodes attached to the surface of thebody. • Subject supine,relaxed. • Temperature of the room :neutral.
ECG Paper • The ECG is recorded on a graphic paper with standard- sizedsquares. • The horizontal axis: time measured inseconds. • 1 small square (1mm): 0.04seconds • 1 large square: 0.20seconds. • 5 large squares: 1second. • The vertical axis: changes ofvoltage. • 10mm = 1cm =1millivolt. • A signal of 1(mV) should move the stylus vertically 1 cm (2 largesquares). • The standard paper speed is25mm/sec.
The 12 standard ECGleads • A lead is formed by a pair ofelectrodes. • Frontal Plane ( 6 limb leads) Bipolar Leads: I , II , and III Unipolar leads: aVR, aVL,aVF • TransversePlane: • Unipolar chest leads: V1 to V6
3 bipolar limb leads: I, II,III • Record the difference in potential between 2limbs. • ECG was first recorded by placing electrodes on 3 places: Right and Left arms and Leftleg • (Recording+veEde) (-ve referenceEde) • Depolarization moving towards a +ve Ede produces a +vedeflection. • Depolarization moving in the opposite direction produces a –vedeflection.
Lead I: Left arm Ede is +ve, the other is–ve. • Lead II: Edes on the right arm and the leftleg with the leg+ve. • Lead III: Ede of the left arm is –ve, Ede ofthe left leg is+ve. • The 3 leads arranged as a triangle are knownas • Einthoven’striangle.
I II III
Formation of the triaxialsystem & assignment of degrees to leads I, II,III • By bringing the sides of the triangle to the commoncenter. • The axes are 60°apart. • Axis of a lead: direction from the negative to the positiveelectrode • Lead I (+) is at0° • Lead II (+) is at+60° • Lead III (+) is at+120°
Augmented unipolar limb leads aVR, aVL, andaVF • Are recordings between 1 limb and the other2 limbs. • aVR (augmented,Voltage, Right arm+ve) • aVL: uses left arm as+ve. • aVF: uses left leg as+ve.
Leads aVR, aVL, aVF cross at # anglesand produce an intersection of 3 otherlines. • Angles of 60° like for lead I, II,III. aVR-150° aVL-30° aVF+90
Formation of hexaxialsystem • Leads aVR, aVF, aVL divide theangles formed by lead I, II,III. • The leadscross precisely at30°.
B: 6 standard “chest leads” depictelectrical • events in the horizontalplan • One +ve Ede is placedon • 6 different positionsaround thechest. • The reference –ve Ede isa combined limblead. e.
Chestleads: • V1 – Right sternal border, 4thICS. • V2 – Left sternal border, 4thICS. • V3 – Halfway between leads V2 &V4. • V4 – Leftmid-clavicular line, 5thICS. • V5– Anterior axillaryline, 5thICS. • V6 – Midaxillaryline, 5thICS.
The standard 12-leadECG • How manyelectrodes? • 10electrodes • How manyleads? • 12leads
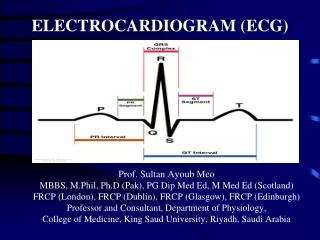
Interpretation of the normalECG • Atrialactivation: • The impulse originates at SA node,spreads through theatria. • This causes positive upwarddeflection. • The P wave represents the depolarization ofboth atria. • • Pw: <0.12sec • < 2.5mm
SeptalActivation: • The impulse spreads to the AV node, common bundle of His and R and Lbundle branches then enters the IVseptum. • This occurs during PRsegment.
PR interval: P wave + PRsegment. • Time of transmission of electrical impulse from the beginning of atrial depolarization to the beginning of ventriculardepolarization. • PR: 0.12 - 0.20 seconds (less than 1 largesquare). • PR prolonged > 0.20 seconds. First degree heartblock. • PR shortens as heart rateincreases.
Ventriculardepolarization • The wave of depolarization spreads in the Purkinje fibers to all parts of theventricles. • The initial negative deflection is Qwave. • The first positive deflection is Rwave. • The negative deflection after R wave is : Swave. • QRS duration: < 0.10sec.
Ventricular repolarization: Twave • Ventricular repolarization represented byST segment and Twave. • ST segment: period between the end of QRSand the start of Twave. • QT interval: from beginning of Q wave to endof T wave (ventricular dep and rep) < 0.43sec. • ST interval: QT-QRS = 0.32sec.
Examples of ECGabnormalities • Prominent U wave:hypokalaemia. • Tall T wave:hyperkalaemia. • Short QT interval:hypercalcaemia. • Prolonged QT interval:hypocalcaemia. • ST elevation, T inversion, large Qwave: • myocardialinfarction.
Cardiacaxis • The mean QRS vector is the preponderant direction of the potential duringdepolarization. • The mean electrical axis of the ventricles is59°.
Inspectionmethod RIGHT AXISDEVIATION
Rythm Sinus rhythm: P wave beforeeveryQRS: Impulse from SAnode Sinus Regular : distance between R-R:constant RR Irregular : Unequal R-Rintervals
Rythm • Sinus arrythmia (normal physiologicalphenomenon) • Deep inspiration :Rwaves closer :fastrate • Deep expiration:bradycardia
Heartrate Examine the distance between QRScomplexes. If the distances are regular, use one of these twoformulas: 300 Big squares betweenR-R Or: 1500 Small squares betweenR-R To obtain the heart rate in beats perminute.
1 complex every 1major division =300/min 1 complex every 2major divisions =150/min 1 complex every 3major divisions =100/min 1 complex every 4major divisions =75/min 1complexevery 5major divisions =60/min 1complexevery 6major divisions =50/min