Download
1 / 17
170 likes | 394 Vues
Analysis of electrocardiogram. 5 th practice Medical Informatics Biomedical Signal Processing TAMUS, Zoltán Ádám zoltanadam_tamus@yahoo.com. The electrocardiogram (ECG). The electrical manifestation of the contractile activity of the heart

E N D
Analysis of electrocardiogram 5thpractice Medical InformaticsBiomedical Signal Processing TAMUS, Zoltán Ádám zoltanadam_tamus@yahoo.com
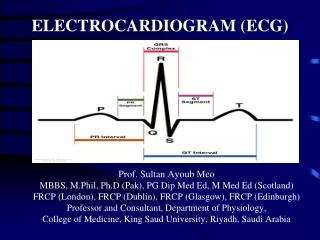
The electrocardiogram (ECG) The electrical manifestation of the contractile activity of the heart The ECG can be easily recorded with surface electrodes on the limbs or chest (Einthoven’s triangle) The waveshape is altered by cardiovascular diseases
The electrocardiogram (ECG) Einthoven’s triangle
The electrocardiogram (ECG) The ECG is an electrical signal (function of time)
The electrocardiogram (ECG) The SA node fires
The electrocardiogram (ECG) • Slow-moving depolarization (contraction) of the atria • The P wave in ECG • 0.1-0.2 mV • 60-80 ms
The electrocardiogram (ECG) • Propagation delay at atrio-venricular (AV) node • Normally iso-electric segment • PQ segment • 60-80 ms
The electrocardiogram (ECG) His bundle, the bundle branches, and the Purkinje system of specialized conduction fibers propagate the stimulus to the ventricles at high rate
The electrocardiogram (ECG) • The wave of stimulus spreads rapidly from the apex of the heart upwards • Rapid depolarization (contraction) of ventricles • QRS wave • 1 mV • 80 ms
The electrocardiogram (ECG) • The ventricular muscle cells possess a relatively long action potential 300-350 ms • Result: iso-electric segment • ST segment • 100-120 ms
The electrocardiogram (ECG) • Repolarization (relaxation) of ventricles causes slow T wave • 0.1-0.3 mV • 120-160 ms
Artifacts in ECG • Physiological interference • Respiration, squirms, coughs etc. • Mother’s ECG appearing with the ECG of the fetus • Electromagnetic interference • TV and radiostations, CRTs, computers, fluorescent lamps • Result: noise in the ECG signal
Noise in ECG • Signal • Deterministic signal: • the value at a given instance of time may be computed using a closed-form mathematical function of time or • Predicted from a knowledge of a few past values of the signal • Nondeterministic signal (random signal): • That does not meet the conditions of the deterministic signal • The noise may be random, structured (deterministic) and physiological
Noise filtering • Random noise • ensemble average: 0 • Reduction: Moving Average (MA) filter • general form: • bk:filter coefficients
Noise filtering • Examples of MA filters • von Hann or Hanning filter: • 8-point average:
Reference Rangaraj M. Rangayyan: Biomedical Signal Analysis, IEEE Press/Wiley, New York, NY, 2002.
Exercises • 1. Observation of noisy ECG signal • 2. Filtering the noisy ECG signal by MA filter • von Hann or Hanning filter • 8-point MA filter sample files: http://zoltanadam.fw.hu software: MS Excel