Download
1 / 25
250 likes | 275 Vues
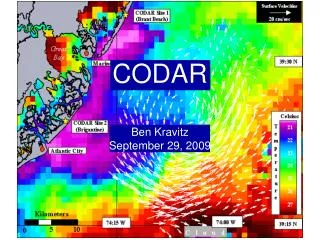
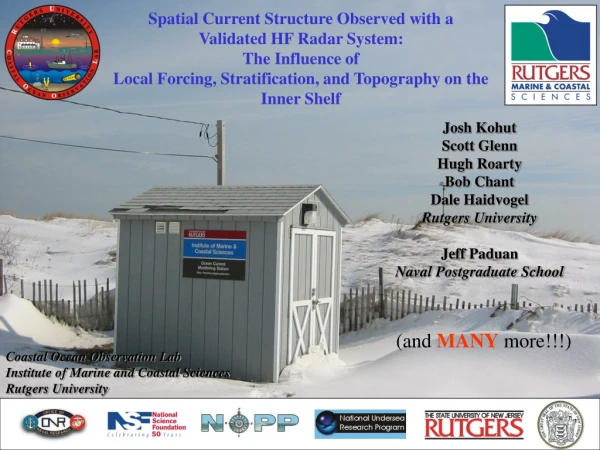
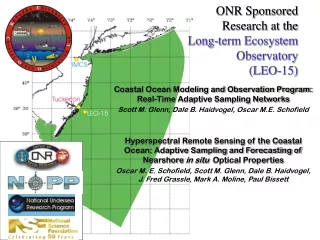
This study focuses on the validation and optimization of a CODAR HF radar system at the Longterm Ecosystem Observatory. The research includes total vector calculations, comparisons with moored ADCP systems, assessment of radial and tidal velocities, and role of antenna patterns in signal direction determination. Results show angular dependency, good comparisons in total vector coverage areas, and the value of antenna pattern measurements in system optimization. Interpolation software enhances system performance, and the quantity and quality of data points impact overall results.

E N D
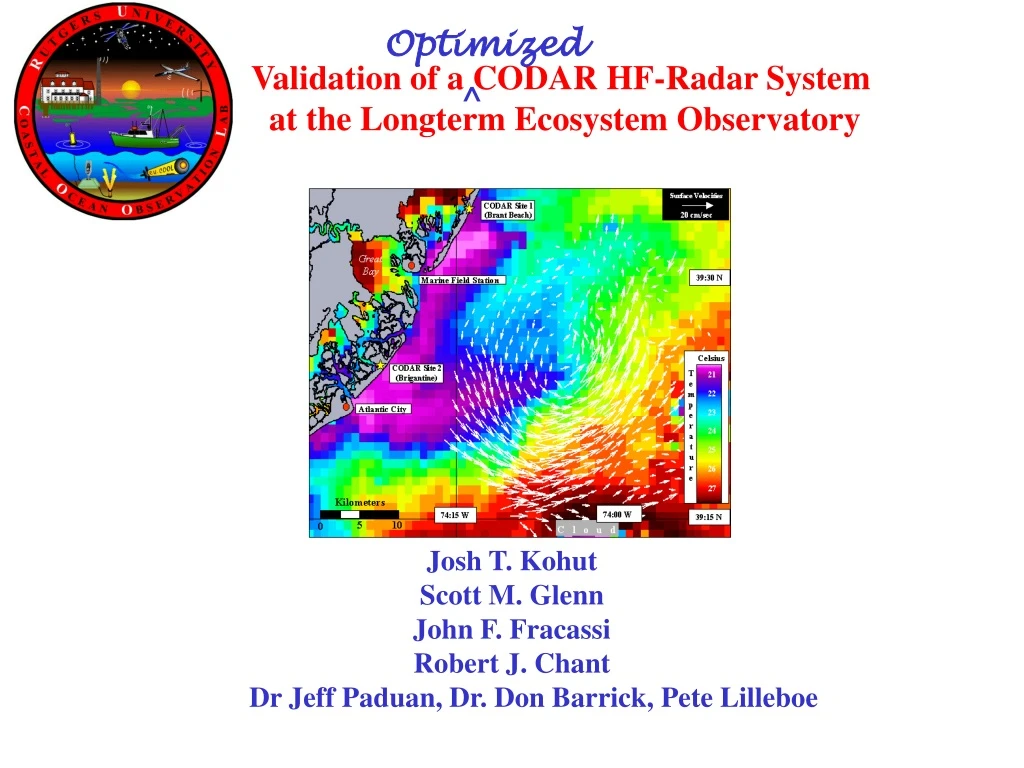
Optimized Validation of a CODAR HF-Radar System at the Longterm Ecosystem Observatory ^ Josh T. Kohut Scott M. Glenn John F. Fracassi Robert J. Chant Dr Jeff Paduan, Dr. Don Barrick, Pete Lilleboe
CODAR Total Vector Calculation Kilometers CODAR North 0 5 10 Little Egg Harbor Great Bay LEO-15 A T L A N T I C O C E A N Atlantic City
CODAR Total Vector Calculation Kilometers 0 5 10 Little Egg Harbor Great Bay LEO-15 A T L A N T I C O C E A N CODAR South Atlantic City
CODAR Total Vector Calculation Kilometers CODAR North 0 5 10 Little Egg Harbor CODAR Central Site Great Bay ? LEO-15 A T L A N T I C O C E A N CODAR South Atlantic City
C Radial Velocity Comparison with ADCP C CODAR Site Moored ADCP 25 km A 25 cm/s
209 210 211 212 213 214 215 216 209 210 211 212 213 214 215 216 Raw Velocity Comparison with ADCP C Northern Site RMS = 7.2 cm/s ADCP CODAR Time (year-day) Southern Site RMS = 9.5 cm/s Time (year-day)
209 210 211 212 213 214 215 216 209 210 211 212 213 214 215 216 Tidal Velocity Comparison with ADCP C Northern Site RMS = 1.6 cm/s ADCPCODAR Time (year-day) Southern Site RMS = 4.3 cm/s Time (year-day)
A C Radial Velocity Comparison with ADCP A CODAR Site Moored ADCP 25 km A 25 cm/s
Raw Velocity Comparison with ADCP A Northern Site RMS = 19.5 cm/s ADCPCODAR A 200 201 202 203 204 205 206 Time (year-day) Southern Site RMS = 19.6 cm/s 200 201 202 203 204 205 206 Time (year-day)
Role of Antenna Patterns in Signal Direction Determination
Role of Antenna Patterns in Signal Direction Determination Loop 1 Loop 2
Measured vs. Ideal Antenna Patterns 8 ft Antenna Elements
Measured vs. Ideal Antenna Patterns 4 ft Antenna Elements
Configuration Tests • Ideal Antenna Pattern Assumption (8 foot elements) • Ideal Antenna Pattern Assumption (4 foot elements) • Smoothed Measured Antenna Patterns (4 foot elements) • Measured Antenna Patterns (4 foot elements) • Interpolation (Guassian Fit)
4 ft Ideal Patterns RMS = 8.6 cm/s R2 = 0.78 NP = 61 Northern Site Antenna Comparisons 8 ft Ideal Patterns RMS = 17.4 cm/s R2 = 0.14 NP = 456
4 ft Smooth Patterns RMS = 9.0 cm/s R2 = 0.80 NP = 120 Northern Site Antenna Comparisons 4 ft Ideal Patterns RMS = 8.6 cm/s R2 = 0.78 NP = 61
4 ft Measured Patterns RMS = 8.3 cm/s R2 = 0.84 NP = 114 Northern Site Antenna Comparisons 4 ft Smooth Patterns RMS = 9.0 cm/s R2 = 0.80 NP = 120
4 ft Interpolated Patterns RMS = 7.9 cm/s R2 = 0.86 NP = 278 Northern Site Antenna Comparisons 4 ft Measured Patterns RMS = 8.3 cm/s R2 = 0.84 NP = 114
4 ft Ideal Antenna Patterns 90 25 km 25 km 80 70 60 50 40 30 20 10 Northern Site Radial Coverage 8 ft Ideal Antenna Patterns Percent Coverage
4 ft Measured Patterns 90 25 km 25 km 80 70 60 50 40 30 20 10 Northern Site Radial Coverage 4 ft Ideal Patterns Percent Coverage
4 ft Interpolated Patterns 90 25 km 25 km 80 70 60 50 40 30 20 10 Northern Site Radial Coverage 4 ft Measured Patterns Percent Coverage
Summary • Validation was angularly dependent prior to system tests • Good comparisons within total vector coverage area • Poor comparisons near the coast • Pattern measurements proved valuable in system optimization • Measured vs. smooth/measured patterns showed no real difference • Interpolation software further optimized the system • Number of data points • Qualtiy of data points
8 ft Ideal Patterns RMS = 17.4 cm/s R2 = 0.14 NP = 456 4 ft Interpolated Patterns RMS = 7.9 cm/s R2 = 0.86 NP = 278 Summary
4 ft Interpolated Patterns 8 ft Ideal Patterns 90 25 km 25 km 80 70 60 50 40 30 20 10 Percent Coverage Summary