Download
1 / 82
820 likes | 836 Vues
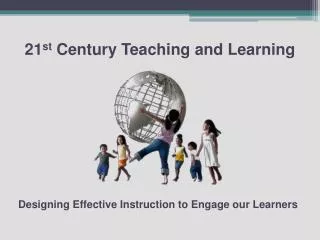
Explore the impact of educational technology and 1:1 student-device ratio on pedagogy and student outcomes. Learn about successful programs like Maine Learning Technology Initiative and Auburn Schools' iPad program.

E N D
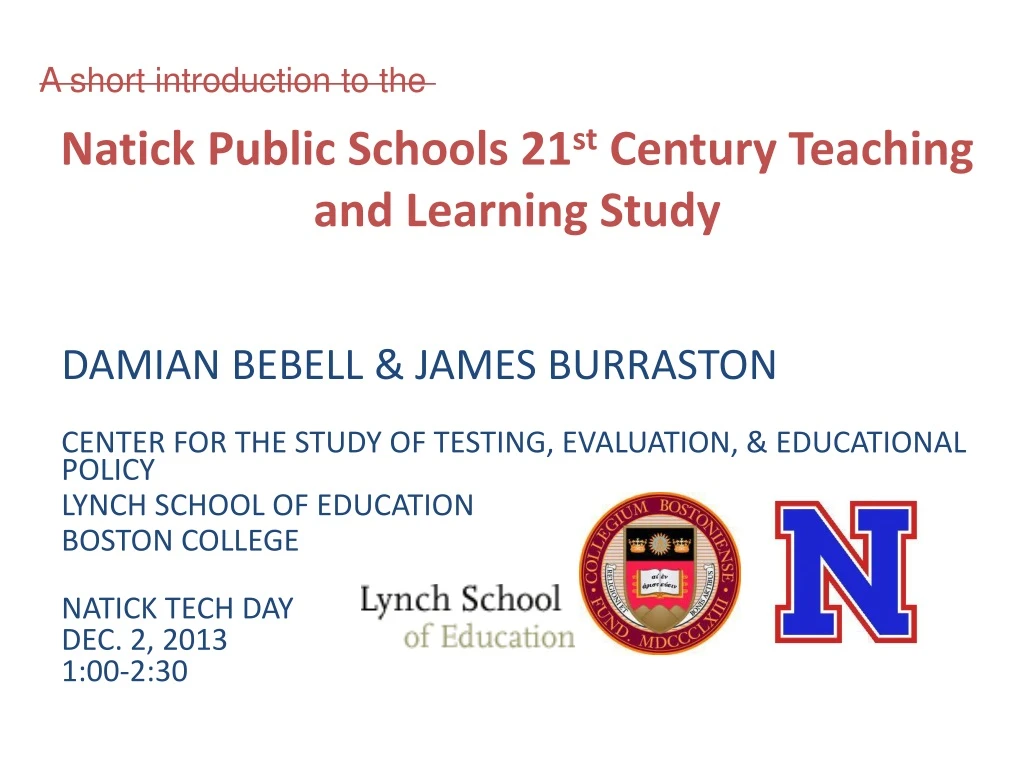
A short introduction to the Natick Public Schools 21st Century Teaching and Learning Study DAMIAN BEBELL & JAMES BURRASTON CENTER FOR THE STUDY OF TESTING, EVALUATION, & EDUCATIONAL POLICY LYNCH SCHOOL OF EDUCATION BOSTON COLLEGE NATICK TECH DAY DEC. 2, 2013 1:00-2:30
Measurement background and perspective How do we define and quantify changes in education? How to study the impact of educational technology if access is shared and use is sporadic? Source: Market Data Retrieval, Public School Technology Survey 1998-2006; Education Week, 2007
Educational technology research 1:1 is the critical student:device ratio 1:1 defines not only technology access, but underlying pedagogical inferences Lots of emphasis on selection and distribution of devices, more limited understanding of how, when and why they are applied Critical role of building level leadership, administrative modeling Teacher PD, pedagogical and content support Time, systematic reflection, questioning, and willingness to adapt/evolve
Framing Research: Asking the right questions… What are your needs? Who is your audience? • Who is impacted by your program? • What is the purpose of changing your practices? • What are the results you would most like to be able to share from your school/program?
Asking the right questions… • What is your project aiming to accomplish? • Common examples: • Evolving teaching and learning practices • Raising student test scores • Providing wider access to materials and resources • Increasing student engagement • Lowering drop out rates • Streamlining adminstrivia and record keeping • Increasing 21st century skills in students • How do you know when you have succeeded?
Maine Learning Technology Initiative • 1st statewide 1:1 laptop program (2002) • 37,000 laptops across 7th and 8th grade “Michael Jordan did not get good at basketball by practicing 42 minutes a week, which is what most kids have in the computer lab, …whether it's a scalpel, baseball bat or a computer, the skill in the use of a tool rests upon practice and familiarity, and that's what these kids are going to have to an unprecedented extent.” "The economic future will belong to the technologically adept." “Transform education” Governor Angus King; Jan. 9, 2002 http://www.wired.com/gadgets/mac/commentary/cultofmac/2002/01/49046
Auburn Schools (ME) iPad K-3 Program • District-wide implementation of 1:1 iPads (2010) • Identified need to increase student literacy and language acquisition by grade 4 • Academic/cognitive outcomes • Research partnership • Randomized pre/post study on 1st year kindergarten implementation (12 weeks)
Results: Average Observation Surveyof Early Literacy Achievement
Time to Know (T2K) Study PS327 Brownsville, Brooklyn • 724 students • 98% non-White • Highest concentration of public housing in US 2 year Pre/Post Comparison Design Study Outcomes: • Student engagement • Student retention • Student achievement • Digital Citizenship 1:1 laptop and digital teaching platform across 4th and 5th grade
T2K Study Outcomes • 79% of students reported more engagement in class. • Increase in variety of instructional strategies/resources employed by teachers • Skype partnership with middle-eastern students
Increased First Year Student Attendance After accounting for differences across schools, PS-327 students exhibited a statistically significant decrease of about 5 school days in the number of missed school days during the 2010/2011 school year compared to students in the non-T2K Brooklyn setting.
One last 1:1 example Project Ceibal-Uruguay • 1st country wide 1:1 program (2007-2013) • 400,000 students; 16,000 teachers • X0-1 device, wireless Internet connection • “digital connectivity is a basic human right” • 1,000,000th student laptop delivered in Oct. 2013 http://www.youtube.com/watch?v=SnLo-j8GvPM
Who defines your success? Project Ceibal-Uruguay http://www.youtube.com/watch?v=SnLo-j8GvPM • Please consider what outcomes and success indicators might be evaluated/studied based on this introductory short video. • A moment to share our impressions
Who defines your success? Since Ceibal: “Encompassing the video game companies, software development in Uruguay has evolved into a $600 million industry, making the country Latin America’s leader in per-capita software exports.” Feb. 22, 2013 http://www.nytimes.com/2013/02/22/world/americas/uruguays-video-game-start-ups-garner-attention.html?pagewanted=all&_r=0
Asking the right questions… What are you hoping to accomplish? How do you know when you have succeeded? Measurement and research force us to define (and often quantify) objectives and goals.
At some point you will ask (or someone will ask you): Why are you investing in instructional technology? Why are you changing your teaching practices? …questions lead to questions lead to bigger questions… So, let’s bite off the biggest question of all: What is the purpose of school?
Categorize and quantify the wide spectrum of reasons we have schooling in the US. Use content analyses methods to focus is on the perspective of schools themselves. Mission statements are a common “data” point for most schools. • Civic development • Emotional development • Cognitive development • Vocational development • Social development www.purposeofschool.org
Help identify and articulate the components of your goals/outcome by examining your school/district mission statement Emergent analytic coding Content analyses using dichotomous coding
Natick Public Schools VISION The Natick Public Schools is a community focused on and dedicated to all students achieving high standards in a safe, trusting, respectful environment where learning is exciting, dynamic, and engaging.
Natick High School MISSION Natick High School is a community of learners dedicated to helping all students reach their highest academic, physical and social potential. Within a supportive and respectful environment, students are encouraged to be informed, responsible and productive citizens. Recognizing the diversity of our students and the different ways in which they develop, we use a variety of teaching and assessment strategies and offer a range of educational opportunities. Through every aspect of school life, we seek to foster personal responsibility, integrity and honesty in all members of the Natick High School Community.
The components indentified in school mission statements provide an initial indication of what community values and identities are central. How does your school and classroom educational technology programs support these different facets of students’ educational experience? It is not adequate to simply focus exclusively on academic and cognitive outcomes, if your program has a broader reach. Severe limitations of letting others define what you are doing and your own success www.purposeofschool.org
Research/evaluation efforts should… Organize stakeholders and constituents around the goal(s) of your project Define success through the creation of indicators aligned to your project goal(s) Provide data specifically targeted at measuring success relative to your project goal(s) Provide feedback and recommendations for formative reflection Provide your community with evidence and examples of what works (and perhaps what doesn’t)
Leveraging Research and data Formative Information Summative Information The information you collect about your program/initiative can serve to inform the day-to-day operation of your program (formative information) which over time can provide evidence of success/goals met (summative information).
Natick High School EXPECTATIONS FOR STUDENT LEARNING Academic Expectations: Natick High School students will: • write with focus, development and detail. • orally communicate ideas and information coherently and with clarity. • analyze and solve real-world problems. • use appropriate technology to research, organize and present information. • make informed choices and practice behaviors necessary to achieve and maintain their physical well-being. Civic and Social Expectations: Natick High School students will: • conduct themselves with honesty and integrity. • demonstrate personal responsibility for their learning, and in their behavior. • practice social responsibility and active citizenship. From 2013-2014 NHS Program of Study
Digital Conversion? What & Why?1:1 Student Laptop Program Grades 8-12 The purpose of the Digital Conversion Initiative is to employ technology in ways that improve teaching and learning through increased student engagement while teaching the Massachusetts curriculum standards on reading and mathematics. It is imperative to note that this project is a curriculum and instruction project, not a technology project. Through this paradigm shift in methodology, we are changing the way teachers teach and students learn, while utilizing an awesome set of technological tools. http://www.natickps.org/departments/technology/laptopprogram/digitalconversion.cfm
Natick/Boston College Research PartnershipSep. 2012- June 2014 Design and conduct evaluation study to document impacts and changes as students and teachers transition to new technology rich computing environments. Document the evolving teaching and learning practices afforded by the rich learning settings Document how Natick teachers and students accessing, using, and relating to technology in support of teaching and learning. Provide NPS with a rich empirical model (and data) for all future inquiries and investigations concerning the relationship between technology practices and a variety of outcomes: student achievement student engagement students motivation evolution of teaching practices changes in students educational access and opportunities www.bc.edu/natick21
Natick-BC Research/Evaluation Design New Data Collection • 7th- 12th Student Survey (90%+ response rate) (Fall 2010, Fall 2012, Spring 2013, Spring 2014) • 7th- 12th Teacher Survey (90%+ response rate) (Fall 2012, Spring 2013, Spring 2014) • Classroom Observations • Focus Groups (teacher and student) • Administrative Interviews • Student Video Competition Secondary Analyses of Student Data (with parent consent) • Attendance Analyses • Course taking Patterns (AP courses, Honors courses) • GPA • MCAS Developing a culture of systemic reflection using data and research
Results Available to Date Examine student learning practices over the 2012/2013 school year. 2) Examine teaching practices over the 2012/2013 school year. 3) Examine how student and teacher practices changed with 1:1 student computing access. 4) Examine student attitudes towards technology and school. 5) Examine teachers attitudes towards technology and school. 6) Examine the potential relationship and impacts of student technology practices on achievement, course taking behavior, and other success indicators.
Student Survey Response Rates 91% Fall 2010 7th grade response rate
Examine student learning practices over the 2012/2013 school year Average # of days that of Natick student used computers in class by grade level (Spring 2013)
Examine student learning practices over the 2012/2013 school year (2) Average # of days that of Natick student used computers in class by grade level (Spring 2013)
Examine student learning practices over the 2012/2013 school year (3) Average # of days students used computers by subject area according to NHS students (Spring 2013)
Examine student learning practices over the 2012/2013 school year (4) Comparison of teacher and student reported use of computers in the classroom by subject area at Natick High School (Spring 2013)
Examine student learning practices over the 2012/2013 school year (5) Comparison of student reported use of computers in the classroom by subject area at and grade level (7th-12th) (Spring 2013)
Examine student learning practices over the 2012/2013 school year (6) Average frequency of student computer use across subject areas (as estimated by teachers in Spring 2013)
Examine student learning practices over the 2012/2013 school year (7) Average frequency of student computer use across subject areas by gender (Spring 2013)
Examine student learning practices over the 2012/2013 school year (8)
Examine student learning practices over the 2012/2013 school year (9) Comparison of low income (SES) students' specific uses for technology in school
Examine student learning practices over the 2012/2013 school year (10) Comparison of honors-level students’ frequency of technology use in school Student use=dark shade Teacher use= light shade