VERTICAL ALIGNMENT
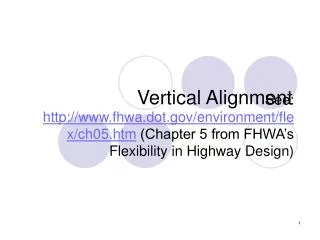
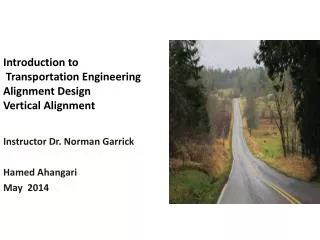
VERTICAL ALIGNMENT. Spring 2014. Vertical Alignment. Geometric Elements of Vertical Curves. Passing Lanes. Vertical Grades. Sight Distance. Vertical Alignment. Highway engineers generally separate the characteristics of variations in typography according to the terrain:

VERTICAL ALIGNMENT
E N D
Presentation Transcript
VERTICAL ALIGNMENT Spring 2014
Vertical Alignment Geometric Elements of Vertical Curves Passing Lanes Vertical Grades Sight Distance
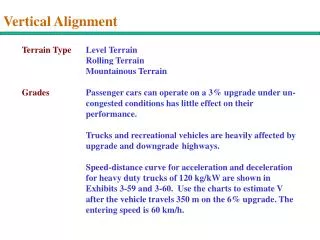
Vertical Alignment • Highway engineers generally separate the characteristics of variations in typography according to the terrain: • Level terrain: highway sight distances, as governed by both horizontal and vertical restrictions, are usually long or can be made without construction difficulty. • Rolling terrain: natural slopes consistently rise above or fall below the road grade, and occasional steep slopes offer some restriction to normal alignment. • Mountainous terrain: longitudinal and transverse changes in the elevation of the ground are usually abrupt, and benching and side hill excavation are frequently needed.
Vehicle Operational Characteristics • Passenger cars: Grades as steep as 4% to 5% generally do not affect speed of most vehicles (may affect some compact/subcompact vehicles) • Trucks: • Effects on speed much more important • Maximum speed on upgrade is determined length and steepness of the grade, and the truck’s weight/power ratio (gross weight/engine power)
Speed distance Curves for Trucks Crawl Speed
Operational Characteristics of Trucks • Travel time (and, therefore speed) of trucks on grades is directly related to the weight/power ratio • Trucks with same weight/power ratios have similar operating characteristics • Units are kg/kW (metric) or lb/hp (U.S.) • Trucks with a ratio above 200 lb/hp have acceptable operating characteristics from the standpoint of highway users • Improve performance: lower weight and/or increase power
Control Grades for Design • Maximum Grades: • 5% is considered adequate for design speed of 70 mph • 7% to 12% is considered acceptable for design speed of 30 mph; if more important highways 7% or 8% should be used as the max • Values should fall between these extremes for other design speeds • Can use 1% steeper if the upgrade length is below 500ft • Use maximum design grade very infrequently
Control Grades for Design • Minimum Grades: • The minimum grade is provided for drainage purposes • Typical 0.5% to 0.3% (for high-type pavement) • Particular attention should be given to the design of storm water inlets and their spacing
Climbing Lanes • Climbing lanes are increasingly used to decrease the amount of delay and improve safety (especially for 2-lane highways) • There are not designated as three-lane highways, but as a two-lane highways with an added lane • Climbing lanes are designed for each direction independently of each other • Where climbing lanes are provided, there has been a high degree of compliance by drivers
Climbing Lanes • Criteria for two-lane highways: • Upgrade traffic flow rate in excess of 200 vehicles per hour • Upgrade truck flow rate in excess of 20 vehicles per hour • A reduction in 10 mph or greater in operational speed of trucks • Level-of-service E or F (computed by HCM) • A reduction of two or more LOS between entrance and upgrade segments
Climbing Lanes • Location of climbing lane • Depends on the where the truck will reduce its speed by 10 mph • Should extend the climbing lane beyond the crest vertical curve to allow trucks to accelerate to previous speed • Make sure the climbing lane is wide enough • Make use of signs “Slower Traffic Keep Right” or “Trucks Use Right Lane” • Optimum length: 0.5 to 2.0 miles • Taper length at the end: L=WS (W=width in ft, S=speed in mph) • Note: climbing on multilane highways usually not justified (usually based on capacity analysis)
Vertical Curves • There are two types of vertical curves: • Crest curves • Sag curves • Design controlled by stopping sight distance • On occasion, decision sight distance may be needed • Vertical curves should result in a design that is safe, comfortable in operation, pleasing in appearance, and provide adequate drainage
Vertical Curves • Some design issues: • The rate of change of grade (defined as the K-Value: K = L /|A| ) should be kept within tolerable limits • Appearance can be important: short vertical curves may give the appearance of sudden break in profile • For sag curves: should retain a grade no less than 0.30% within 50 ft from the level point (i.e., changes from negative to positive grades) • The use of asymmetrical vertical curves may be required (e.g., sight restriction in sag curve)
Vertical Curve A = G2 – G1 Rate of change of grade K = L / |A| Offset y = 4E(x/L)2 External Distance E = M = A L / 800 Vertical Point of Intersection Ele. of P = [ele. Of VPC + (G1 / 100) x] + y X = L|G1|/ (|G1 – G2|) (high or low point) Vertical Point of Tangency Vertical Point of Curvature
Vertical Curve A 600-ft vertical curve connects a +4% grade to a -2% at station 25+60.55 and elevation 648.64 ft. Calculate the location and elevation of the PVC, the middle of the curve, the VPT, and the curve elevation at stations 24+00 and 27+ 00.
Vertical Curve Partial answer: A = -2 - (+4) = -6% K = 600/|-6| = 100 E = -6 x 600 / 800 = -4.5 ft Elevation of curve in the middle = 648.64 – 4.5 = 644.14 Using the curve elevation equation: Ele P = [ele VPC + (G1/100) x] + y 644.14 ft = [ele VPC + 4/100 x 300] – 4.5 Ele VPC = 636.64 Station 22+60.55
Vertical Crest Curve Equation below is used for h1=3.5 ft and h2=2.0 ft
Vertical Crest Curve For a design speed of 50 mph, determine the minimum length of a crest vertical curve with A=-4%. Assume h1 = 3.5 ft and h2 = 2.0 ft.
Vertical Crest Curve For a design speed of 50 mph, determine the minimum length of a crest vertical curve with A=-4%. Assume h1 = 3.5 ft and h2 = 2.0 ft. Stopping Sight Distance for 50 mph: From Exhibit 3-1, SSD = 425 ft S < L L = 4 x 4252 / 2158 = 334 ft S > L L = 2 x 425 – 2158 / 4 = 310 ft The length of curve is310 ftsince S > L
Vertical Crest Curve • Design controls for crest vertical curves: • The minimum lengths of vertical curve for different values of A (G2 – G1) to provide the minimum stopping sight distance is provided in Exhibit 3-75 • K = L /|A| (K= rate of vertical curvature, L=length of curve, A=difference in grade) • K is used to compare different curves; it covers all combinations of A and L for any one design speed • Minimum length: • Lmin = 3V (V = mph, L = ft)
Vertical Crest Curve Previous example: 310 ft
Vertical Crest Curve • Passing Sight Distance • Same principle as SSD, but with different values: h2 = 3.5 ft and S=PSD (Exhibit 3-7) • The lengths are 7 to 10 times higher
Vertical Sag Curve • The lengths are established based on four criteria: • Headlight sight distance (h= 2 ft, 1o divergence angle) • Passenger comfort (max acc = 1 ft/s2) • Drainage control (minimum 0.3%) • General appearance (same as crest curve)
Vertical Sag Curve Minimum Length for comfort:
Vertical Sag Curve For a design speed of 60 mph, determine the length of the sag vertical curve with A = +10%
Vertical Sag Curve For a design speed of 60 mph, determine the length of the sag vertical curve with A = +10% Stopping Sight Distance: 570 ft For S < L L = 10 x 5702 / (400 + 3.5 x 570) = 1,357 ft Check for comfort: L = 10 x 602 / 46.5 = 774 ft (L = 1,357 ft is higher)
Vertical Sag Curve 1,357 ft
Vertical Sag Curve • Since many sag vertical curves are used at grade separated locations (overpass, bridges), highway engineers need to determine if the under passing structure creates a visibility impediment • Can use a graphical method or the equations provided in the text
Vertical Sag Curve S > L:
Vertical Sag Curve S < L:
General Controls • Smooth gradeline with gradual changes is the preferable design alignment • “Roller-coaster” type of profile should be avoided (old roads) • A “broken-back” gradeline should be avoided • Sag vertical curves should be avoided in cuts unless adequate drainage can be provided
General Controls • Combinations of horizontal and vertical alignment: • Horizontal and vertical alignments should not be designed independently • Highway cost is an important issue; thus, you often need to design them together • Vertical curvature superimposed on horizontal curvature generally results in more pleasing facilities • Sharp horizontal curvature should not be introduced near the top of a pronounced crest vertical curve • See other design considerations in AASHTO Green Book