Download
1 / 23
230 likes | 327 Vues
Fish and Energy Impacts Resulting from Reductions in Summer Bypass Spill. July 16, 2003. 2003 Bypass Spill ( NOAA Fisheries). Wholesale Electricity Prices (Mid-Columbia, Average Hydro, 2005-06)*. *In 2005-06, west coast demand and resources are more in balance. . Cost as a Function of Runoff.

E N D
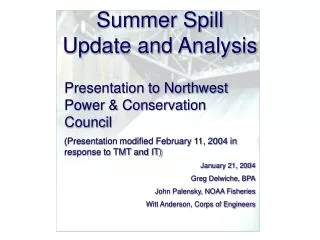
Fish and Energy Impacts Resulting from Reductions in Summer Bypass Spill July 16, 2003
Wholesale Electricity Prices(Mid-Columbia, Average Hydro, 2005-06)* *In 2005-06, west coast demand and resources are more in balance.
Observations • In dry years, flow costs exceed spill costs • In wet years, spill costs exceed flow costs • Flow costs decrease linearly as a function of runoff • In drier years, spill costs increase with runoff until spill limits are reached • Bypass spill costs then decline in wet years as forced spill increases
50-Year Average Annual Cost(millions) • Current bypass spill program $142 • Spring only $74 • Summer only $68 • July only $30 • August only $38 • Gas limit at 115% $97 • Savings $45 • Spring savings $36 • Summer savings $9 • July savings $5 • August savings $4
Alternatives Under average, high and low flow conditions, compare fall chinook survival using 2000 Biological Opinion spill levels to: • No bypass spill in July and August • No bypass spill in August
Starting with 1000 fish, population change with no spill in July or August
Starting with 1000 fish, population change with no spill in July or August (CRiSP)
Starting with 1000 fish, population change with no spill in August
Starting with 1000 fish, population change with no spill in August (CRiSP)
Decrease in Harvest and Escapement Upper Columbia Fall Chinook
Uncertainties • Mixed populations • Variable yearly outmigration • May increase adult turbine mortality
Positive Aspects • Affect on listed stocks very low • Stocks affected generally healthy • May help adult migration • May use saved revenues more cost-effectively for fish
Alternatives to Current Summer Spill Levels • More flexible summer spill program • Reduce predation • Increase hatchery production • Less costly passage improvements at dams • Reduce harvest with compensation • Protect more habitat • Combination of above