Download
1 / 46
470 likes | 718 Vues
ZiFi: WiFi Network Discovery via Cross-platform Interference Signatures. Guoliang Xing Assistant Professor Department of Computer Science and Engineering Michigan State University. Outline. ZiFi: WiFi discovery using ZigBee radio [MobiCom’10]

E N D
ZiFi: WiFi Network Discovery via Cross-platform Interference Signatures Guoliang Xing Assistant Professor Department of Computer Science and Engineering Michigan State University
Outline • ZiFi: WiFi discovery using ZigBee radio [MobiCom’10] • A novel Digital Signal Processing algorithm to finding periodic interference patterns • A stochastic WiFi beacon detector • Data Fusion improves sensing coverage [MobiCom’09] • Negotiate power and performance for RFID [PerCom’10] • Multi-channel interference measurement & modeling [RTSS’09] 2
Mobile WiFi Access • WiFi usage from mobile users is soaring • AT&T public WiFi: 85.5 mi connections in 2009, 121.2 mi in the first half 2010, 30% up from Q1 to Q2 of 2010. • 24% usage from non-laptop devices: smartphones, PDA [1]. • Growth of WiFi hotspots has fell behind • 5.2% up from Q1 to Q2 of 2010 [1]. • Reality of urban WiFi coverage for mobile users • Long uncovered periods, poor association success rate… [1] JiWire Q2 2010 Mobile Audience Insights Report 3
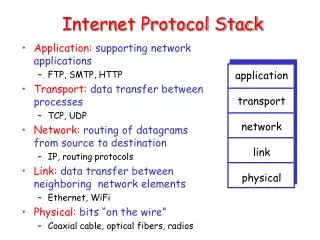
WiFi Discovery: State of the Art • Active/passive scan consumes significant power • Predict WiFi by contexts • Location, cellular towers, BT contact patterns • Reliance on historical info • Out-of-band signaling • Significant modification to WiFi infrastructure 4 WiFi Access Point (AP) WiFi Access Point (AP)
Motivation for a New Approach • Many mobile devices have multiple interfaces • 802.11 b/g/n and Bluetooth • ZigBee: wireless technology for industrial/home automation • Most these radios share the open 2.4GHz band • Significant interference between different radios • Ex: WiFi interferes 12 of total 16 ZigBee channels • Can we turn the curse into blessing? • Detect WiFi through unique interference signatures on ZigBee/BT receivers 5
Basic Idea • Low-power radio remains active • Sample wireless signals via Received Signal Strength (RSS) indicator • Identify unique features of RSS samples • Activate WiFi interface if WiFi hotspot detected BT/ZigBee WiFi TM RSS samples ZigBee sensor
RSS Features of WiFi Signals • Signal magnitude varies significantly • Frame duration and inter-arrival gap vary with apps and 802.11 versions • Resemblance with signals of other RF sources gap duration magnitude RSS samples
802.11 Beacons as WiFi Signature • All WiFi APs periodically broadcast beacons • Beacons broadcasted at lowest rate • Beacon period is unknown! • Default 102.4 ms,typically 100 – 200 ms • Low SNR: up to 103 data frames bw beacons! • False positives and negatives • Noise/data frames may also exhibit periodicity • Beacons may become aperiodic due to contentions
ZiFi System Architecture WiFi radio ZigBee radio Mobile Device Constant False Alarm Rate Detector Common Multiple Folding RSS Sampling & Shaping WiFi Access Point amplify periodic signals threshold 100
Basic Idea of Folding • Amplify a signal of period P in N samples • Total number of additions is N-P, N>104 • High complexity of folding on many periods! 3 2 1 6 5 4 folding 7 8 9 3 5 1 4 6 2 7 8 9 3 1 2 An example of folding on period 3
Common Multiple Folding • Key observation: folding on period P can be computed from folding on Q if QmodP = 0 • Recursively apply this idea • Fold on LCM of a set and then partition it folding on period 6 folding on period 3 3 2 1 6 5 4 RSS sample index 6 3 5 2 4 1 9 8 7 12 9 11 8 10 7 12 11 10
CMF Tree • Encode the process by a tree • A node represents a period set and its LCM • Children’ period sets are partition of parent’s set # of additions N-2520 (2,3,….,9,10) 2520 2520-72 2520-70 Example: Folding N samples on periods (2,3,….9,10) (2,3,4,6,8,9) 72 (5,7,10) 70 72-18 72-8 70-7 70-10 (3,6,9) 18 (8,4,2) 8 (7) (5,10) 10 Opt CM tree is a binary tree! 18-6 8-4 8-2 18-9 10-5 (3,6) 6 (9) 9 (2) (4,2) 4 (5) 6-3 (3)
802.11 Beacons as WiFi Signature • All WiFi APs periodically broadcast beacons • Beacons broadcasted at lowest mod. rate • Beacon period is unknown! • Default 102.4 ms,typically 100 – 200 ms • Low SNR: up to 103 data frames bw beacons! • False positives and negatives • Noise/data frames may also exhibit periodicity • Beacons may become aperiodic due to contentions X
ZiFi System Architecture WiFi radio ZigBee radio Mobile Device Constant False Alarm Rate Detector Common Multiple Folding RSS sampling & shaping WiFi Access Point amplify periodic signals threshold peak caused by data frames
Modeling FP and FN Rates • Derive FP/FN rate based on 802.11 CSMA model • PF rate = Prob. (max. folding result ≥ λ| no beacons) • PN rate = Prob. (max. folding result < λ| beacons) detector threshold
Evaluation Test-bed • Test-bed consists of 4 802.11g APs, 4 netbooks, 2 TelosB motes, and a Nokia N73 phone. MiniSD based ZigBee module USB based TelosB mote
Experimental Setup • Evaluation metrics • Detection delay, accuracy, computation and energy overhead ZiFi node WiFi client running traffic generator D-ITG WiFi access point
Detection Accuracy • ZiFi-opt: choose opt threshold using FP bound • ZiFi-α: threshold fixed to α • High α low FP rate, high FN rate • Low α low FN rate, high FP rate
Summary • ZiFi: a novel system to detecting WiFi hotspots using ZigBee radio • A novel Digital Signal Processing algorithm to amplifying beacons in interference signals • A stochastic signal detector to ensuring detection performance of ZiFi • Evaluation on Linux netbooks and a Nokia N73 smartphone
Outline • ZiFi: WiFi discovery using ZigBee radio • Data fusion improves sensing coverage [MobiCom’09] • Negotiate power and performance for RFID [PerCom’10] • Multi-channel interference measurement & modeling [RTSS’09] 20
Sensing Coverage: State of the Art • Numerous studies on coverage protocols/analysis • Our earlier work [sensys 03, TOSN 05 ] cited >900 [Google Scholar] • K-coverage and barrier coverage • Most existing results are based on simplistic models • All 5 related papers since MobiCom 04 assumed disc model • Ignored sensing uncertainties and collaboration • Collaborative signal processing theories • Focused on small-scale networks • Made performance analysis of large networks difficult 21
Sensing Model r • The (in)famous disc model • Any target within r is detected • Deterministic and independent sensing • Real-world event sensing • Probabilistic, no cookie-cutter like “sensing range”! • Collaborative sensing is a must Real Acoustic Vehicle Detection Experiments [Duarte 04]
Sensor Measurement Model • Reading of sensor i is yi = si + ni • Decayed target energy • Noise energy follows normal distribution ni ~ N(μ,σ2) • Signal to noise ratio (SNR) is S /σ , 2 ≤ k ≤ 5 Real Acoustic Vehicle Detection Experiments [Duarte 04]
Data Fusion Model • Sensors within distance R from target fuse their readings • The sum of readings is compared again a threshold η • R is the fusion range • False alarm rate PF = 1-N(n· η) • Detection probability PD = 1 –N(n·η - Σsi) R N– CDF of Normal distribution si – Energy reading of sensor i 24
(α,β)-Coverage • A physical point p is (α,β)-covered if • The system false alarm rate PF ≤ α • For target at p, the detection prob. PD ≥ β • (α,β)-coverage is the fraction of points in a region that are (α,β)-covered • Full (α,β)-coverage: any point is (α,β)-covered • Random network deployment • Nodes deployed by Poisson process of density ρ 25
Disc and Fusion Coverage • Coverage under the disc model • Sensors independently detect targets within sensing range r • Coverage under the fusion model • Sensors collaborate to detect targets within fusion rangeR grayscale represents PD • How does network density grow when coverage 1? 26
Coverage with Non-opt Fusion Range • Density ratio ρf/ρd satisfies • ρf << ρdfor high coverage requirement • Fusion range R may grow with network density • Sensing range r is a constant 27
Full Coverage with Opt Fusion Range • ρf and ρd are densities of random networks under fusion and disc models • When k=2 (acoustic signals) • Density significantly reduced via data fusion!
Network Density vs. SNR • For full coverage with fixed fusion range R • Disc model is good for high SNR and small k • Most low-power sensors have low SNRs, and k ≥ 2 29
Outline • ZiFi: WiFi discovery using ZigBee radio • Data Fusion improves sensing coverage [MobiCom’09] • Negotiate power and performance for RFID [PerCom’10] • Multi-channel interference measurement & modeling [RTSS’09] 30
Introduction • RFID technology is widely adopted, and increasingly pervasive • Handheld readers • Mobile phones • PDAs • Motivation: Reduce energy consumption of RFID systems yet provide comparable performance
Motivation 16.7dBm 16.6dBm • As low as possible, but not lower • Almost 100% response rate using “just enough power” 16.5dBm
Solutions • Extensive empirical study on RFID operations • Automatic Power Stepping (APS) algorithm • Save more than 60% energy • Maintain 90% of the original read rate • Robust and resilient to several realistic issues • Interoperable with current C1G2 RFID tags • Calibrated simulator • Source code available at https://www.cs.cityu.edu.hk/~xuntengxu/rfidsim/
Implementation • Implemented on NI-VISN-100 RFID Tester • Compared with commercial reader (CSL CS461) • Evaluated in an anechoic chamber to ensure repeatability NI-VISN-100 CSL CS461 anechoic chamber Xunteng Xu, Lin Gu, Jianping Wang, Guoliang Xing, PerCom 2010, best paper candidate (3 out of 227 submissions)
Mitigating Interference • Avoid interference by assigning links different channels • 802.15.4: 16 channels in 2.4-2.483 GHz, 5MHz separation s2 s1 theoretical channel bandwidth Interference on adjacent channel channel X channel Y r2 collisions 0 r1 signal power(dbm) -20 -40 ZigBee only has 3 or 4 orthogonal channels! -60 -80 -100 Channel X-1 Channel X 1 MHz
Strongly Overlapping Channels • When two channels are close • Received Signal Strength (RSS) grows nearly linearly with transmit power channel 19, power level [0~31] s1 r1 channel Y, received signal strength (RSS)
Weakly Overlapping Channels • When two channels are not close • RSS donotstrongly correlate with transmit power Sender periodically changes transmit power on channel 19
Summary • Empirical models for inter-channel RSS • Lightweight measurement algorithm • O(M2) complexity for measuring RSS models for M overlapping channels • Our algorithm reduces the complexity to O(M) • Extensions to channel assignment protocols • Evaluation on 30-mote testbed IEEE Real-Time Systems Symposium (RTSS), 2009
Current Research Projects • Interference Measurement, Modeling, and Mitigation • ZiFi: Wireless LAN Discovery via ZigBee Interference Signatures [MobiCom 2010] • Passive Interference Measurement in Wireless Sensor Networks [ICNP 2010] • Exploiting WiFi White Space for ZigBee Performance Assurance [ICNP 2010] • Multi-channel Interference Measurement and Modeling [RTSS 2009] • C-MAC: concurrent model-driven MAC [Infocom 2009] • Information Processing in Sensor and Cyber-physical Systems • Volcanic Earthquake Detection using Wireless Sensor Networks [RTSS 2010] • System-level Calibration for Fusion-based Wireless Sensor Networks [RTSS 2010] • Fidelity-Aware Utilization Control for Cyber-Physical Surveillance Systems [RTSS 2010] • Data Fusion Improves the Coverage of Wireless Sensor Networks [MobiCom 2009] • Impact of Data Fusion on Real-Time Detection in Sensor Networks [RTSS 2009] • Fast Sensor Placement Algorithms for Fusion-based Target Detection [RTSS 2008] • Controlled Mobility and Power Management in Sensor Networks • Negotiate Power and Performance in the Reality of RFID Systems [PerCom 2010] • Rendezvous-based data transport [MobiHoc 08, RTSS 07] • Minimum power configuration [MobiHoc 05] • Impact of sensing coverage on geographic routing [MobiHoc 04] • Integrated coverage and connectivity configuration [SenSys 03]
Modeling Inter-Channel RSS • Sender u on channel x and receiver v on channel y • Strongly correlated channels, sender transmit power P RSS ( ux, vy, P ) = Au,x,v,y × P + Bu,x, v,y • Weakly correlated channels, for given quantile α∊ [0,1] RSS ( ux, vy, α ) = X |Prob(RSS<X) = α determined by measurements
Trace-driven Simulations • Data traces collected from 75 acoustic sensors in vehicle detection experiments [Duarte 04] • α=0.05, β=0.95, deployment region: 1000m x 1000m fusion saves more sensors
(α,β)-Coverage under Fusion Model • The (α,β)-coverage of a network of density ρf opt fusion range grows w density! Г(R) is function of fusion range R, α, β and w(.) optimal fusion range 42
(α,β)-Coverage under Disc Model • Choose sensing range r s.t. if any point is covered by a sensor, the region is (α,β)-covered [Liu 2004] ρd: density of network Q-1: inverse Complementary CDF of std Normal distr. 43
Detection Delay • Beacon period = 98.3 ms • Error rate = FP rate + FN rate Avg. error rate < 5% when delay >786 ms
Coverage + Connectivity • Activate a subset of nodes to achieve: • K-coverage: every point is monitored by at least K sensors • N-connectivity: network is still connected if N-1 nodes fail Active nodes Sensing range Sleeping node Communicating nodes A network with 1-coverage and 1-connectivity
Connectivity vs. Coverage • Network connectivity does not guarantee coverage • Connectivity only concerns with node locations • Coverage concerns with all locations in a region • If Rc/Rs 2 • K-coverage K-connectivity • Implication: given requirements of K-coverage and N-connectivity, only needs to satisfy max(K, N)-coverage • Solution: Coverage Configuration Protocol (CCP) • If Rc/Rs< 2 • CCP + connectivity mountainous protocols ACM Transactions on Sensor Networks, Vol. 1 (1), 2005. First ACM Conference on Embedded Networked Sensor Systems (SenSys), 2003