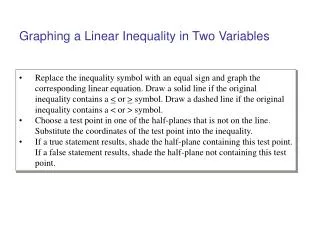
Linear Inequality
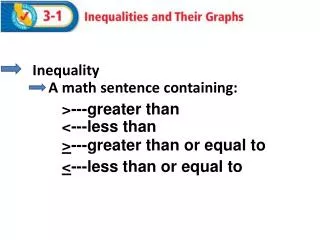
Linear Inequality. A linear inequality is any inequality of the form ax + by ≠ c , where the ≠ can be replaced by >, <, ≥, or ≤. Example 1. Graph the solutions to y ≥ −2 x + 3. y. x. 0 − 0 > 6. Example 2.

Linear Inequality
E N D
Presentation Transcript
Linear Inequality A linear inequality is any inequality of the form ax + by ≠ c, where the ≠ can be replaced by >, <, ≥, or ≤.
Example 1 Graph the solutions to y ≥ −2x + 3. y x
0 − 0 > 6 Example 2 Check the points (0, 0) and (3, −2) to see if they are solutions to the inequality2x − 3y > 6. 2(0) − 3(0) > 6 2(3) − 3(−2) > 6 6 + 6 > 6 12 > 6
y x
Example 3 Graph the solutions to y < 4x − 5. y x
Example Graph y = 4x + 2. Shade with vertical lines the region y > 4x + 2, and shade with horizontal lines the region y < 4x +2.
y x
Example Graph y = −2x + 4. Shade with vertical lines the region y > −2x + 4, and shade with horizontal lines the region y < −2x +4.
y x
Example Graph2x + y > 8.
y x
Example Graph3x − 4y > 2.
y x
Example Graph x > 4.
y x
Example Graphx≤ −3.
y x
Example Graph3x + 4y < 8x − y + 10.
y x
Example Graph10(x + 3) ≥ 4(x − y).
y x
Example Find the solution to y < x + 5 and y > −x + 3. The region below the dashed line through (0, 5) and (−5, 0) and above the dashed line through (0, 3) and (3, 0)
Exercises Graph both of the inequalities in each problem on the same set of axes. Shade the area where the regions overlap darker than the regions where only one of the inequalities is true.
y 45 x y ≤ x + 2 and y > −3x− 1
y −14 x y < x + 3 and y ≤ 2x+ 1
y x 3x + y ≥ 5 and −2x− 3y ≤ 9
y x