Download
1 / 24
240 likes | 535 Vues
Student Growth Percentile. Understanding Alliance CST 2009 and CST 2010 English and Math Growth Adapted from “Growth Model” by John Schacter , Ph.D. Information about The College Ready Promise Growth Model. Online webinars: https:// thevaanetwork.com Quick Start Guide FAQ Sheet.

E N D
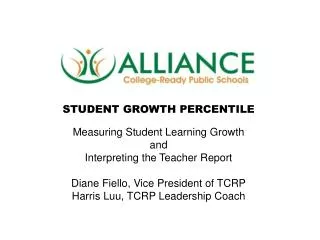
Student Growth Percentile Understanding Alliance CST 2009 and CST 2010 English and Math Growth Adapted from “Growth Model” by John Schacter, Ph.D.
Information about The College Ready Promise Growth Model Online webinars: https://thevaanetwork.com Quick Start Guide FAQ Sheet
What are Student Growth Percentiles (SGP)? Student Growth Percentiles (SGP) measure how much a student has learned from one year to the next compared to other students with similar test scores. • In order to better understand SGP, we need to understand a few key terms
Terminology Scale Score • A converted score so all tests with different question numbers can be compared. Growth • Amount of increase or decrease between scores. Achievement • Scoring in proficient or advanced bands. Median • The middle term or number in a series.
Growth • Growth measures performance from one year to the next. • Growth can either increase or decrease. 600 600 Advanced Advanced 400 400 Proficient Proficient 349 349 375 Basic 345 Basic 299 299 310 Below Basic Below Basic 270 270 280 Far Below Basic Far Below Basic 150 150 CST 2010 CST 2009 CST 2010 CST 2009
Median In this example, 50% of the students scored higher than Eric and 50% of the students scored lower than him. Eric is the median.
Key Concepts about Measuring Growth Growth is distinct from achievement • A student can achieve at a low level but grow quickly, and vice versa Each student is compared only to their academic peers (students with similar achievement levels) • The comparison base for TCRP is all 2nd to 11th grade students in TCRP and LAUSD Demographic variables, socio-economic status and initial achievement have virtually no impact on student growth results
How does SGP show a Student’s Growth? • SGP measures the rate of change students make in relation to their academic peers. This rate of change is reported as a percentile from 1 to 99. • Higher percentiles indicate more growth. • Lower percentiles indicate less growth. Moderate growth Low Growth High growth
Student Growth Percentile (SGP) Score for Elijah 600 Range of students whose beginning scaled score was 305. 400 Advanced 40% 349 Proficient 330 CST ELA SCALE SCORE SGP = 60 305 Basic 299 60% 270 Below Basic Far Below Basic 150 Grade 6 Grade 7
Student Growth Percentile (SGP) Score for Rosa 600 400 91% Advanced 385 352 SGP = 9 349 9% Proficient CST ELA SCALE SCORE Basic 299 Range of students whose beginning scaled score was 385. 270 Below Basic Far Below Basic 150 Grade 6 Grade 7
Reporting SGPs for Teachers Last nameSGP Hernandez 21 Bing 24 Johnson 27 Harrison 32 Morales 34 Portis 47 Jackson 55 Stills 61 Lund 63 Hershberg 74 James 81 Andres 88 Sims 95 • This list is representative for all students of one teacher. • Note: SGPs are sorted from lowest to highest. • The point where 50% of students have a higher SGP, and 50% have a lower SGP is the median. Median SGP for this teacher is55.
Teacher SGP Report Sample Pretest = CST 2009 Posttest = CST 2010 Growth Percentile = SGP Achievement = CST 2010 Proficiency
Candle and Wick Terms Candle is the overall SGP and median of the sample. Example: teacher’s class, school-wide. Wick represents the range of all SGP scores above and below the median. Note: The size of the wick varies depending on the sample size and range above and below the SGP.
Candle and Wick Reports Green candle: SGP and range above 50th percentile. Whitecandle: SGP above the 50th percentile but range extends above and below. Graycandle: SGP below the 50th percentile but range extends above and below. Red candle: SGP and range below the 50th percentile. 100 90 80 70 60 50 Teacher SGP 40 30 20 10 0 Teacher 1 Teacher 2 Teacher 3 Teacher 4
Common SGP Questions • Would my final SGP be influenced by the achievement level of the students entering my class? • In other words: • Do low performing students grow less? • Do middle performing students grow less? • Do high performing students grow less? • Short answer: No
How will the Alliance use SGP Data? • To evaluate teachers (a component of teacher effectiveness calculation) • Determine the amount of growth made by students, teachers, and schools • Analyze if students are growing enough to exceed state standards • Explore if students grow similarly across content areas, grade levels, and classrooms