Download
1 / 6
60 likes | 376 Vues
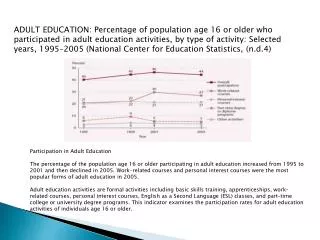
ADULT EDUCATION: Percentage of population age 16 or older who participated in adult education activities, by type of activity: Selected years, 1995–2005 (National Center for Education Statistics, (n.d.4). Participation in Adult Education

E N D
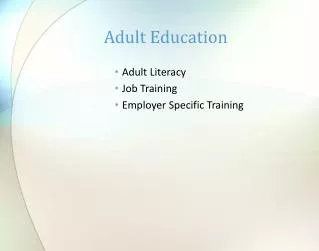
ADULT EDUCATION: Percentage of population age 16 or older who participated in adult education activities, by type of activity: Selected years, 1995–2005 (National Center for Education Statistics, (n.d.4) Participation in Adult Education The percentage of the population age 16 or older participating in adult education increased from 1995 to 2001 and then declined in 2005. Work-related courses and personal interest courses were the most popular forms of adult education in 2005. Adult education activities are formal activities including basic skills training, apprenticeships, work-related courses, personal interest courses, English as a Second Language (ESL) classes, and part-time college or university degree programs. This indicator examines the participation rates for adult education activities of individuals age 16 or older.
Definition of Nontraditional Students(National Center for Education Statistics, (n.d.1))The term "nontraditional student" is not a precise one, although age and part-time status (which often go together) are common defining characteristics (Bean and Metzner 1985). An NCES study examining the relationship between nontraditional status and persistence in postsecondary education identified nontraditional students using information on their enrollment patterns, financial dependency status, family situation, and high school graduation status (Horn 1996). Specifically, in this study, a nontraditional student is one who has any of the following characteristics:* Delays enrollment (does not enter postsecondary education in the same calendar year that he or she finished high school); * Attends part time for at least part of the academic year; * Works full time (35 hours or more per week) while enrolled; * Is considered financially independent for purposes of determining eligibility for financial aid; * Has dependents other than a spouse (usually children, but sometimes others); * Is a single parent (either not married or married but separated and has dependents); or * Does not have a high school diploma (completed high school with a GED or other high school completion certificate or did not finish high school).
Figure 1.—Percentage of undergraduates with nontraditional characteristics: 1992–93 and 1999–2000 Figure 1: SOURCE: U.S. Department of Education, NCES. National Postsecondary Student Aid Study (NPSAS:2000). Percentage of Undergraduate Students with some nontraditional characteristics (National Center for Education Statistics (n.d.2))
Table 1 (National Center for Education Statistics, (n.d.3))
Venn Diagram of relationship between adult learners, nontraditional learners, and traditional learners. The blue shaded are represents traditional learners aged 18 to 24. The red shaded area represents the intersection of age group traditional learners that are a part of nontraditional learners due to shared characteristics. The yellow shaded area represents nontraditional learners that are 25 years of age or older. The green shaded area represents all adult learners including all categories of traditional and nontraditional learners along with any other participants in adult learning experiences.
References: National Center for Education Statistics. (n.d.1). Special Analysis 2002: Nontraditional Undergraduates. Retrieved from: http://nces.ed.gov/programs/coe/2002/analyses/nontraditional/sa01.asp#info National Center for Education Statistics. (n.d.2). Special Analysis 2002: Nontraditional Undergraduates: Figure 1. Retrieved from: http://nces.ed.gov/programs/coe/2002/analyses/nontraditional/figures/fig01.asp?popup=true National Center for Education Statistics. (n.d.3). Special Analysis 2002: Nontraditional Undergraduates: Table 1. Retrieved from: http://nces.ed.gov/programs/coe/2002/analyses/nontraditional/tables/tab01.asp National Center for Education Statistics. (n.d.4). Special Analysis 2002: Nontraditional Undergraduates: Table 1. Retrieved from: http://nces.ed.gov/programs/coe/2007/charts/chart10.asp?popup=true