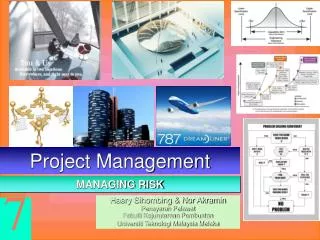
Managing Risk
Managing Risk. Objectives. To Describe Risk Management concepts and techniques To calculate and analyze a project using Probability of completion To be able to calculate and analyze Probability statistics during decision trees To describe Change Management concepts.

Managing Risk
E N D
Presentation Transcript
Objectives • To Describe Risk Management concepts and techniques • To calculate and analyze a project using Probability of completion • To be able to calculate and analyze Probability statistics during decision trees • To describe Change Management concepts
Risk Management Process • Risk • Uncertain or chance events that planning can not overcome or control. • Risk Management • A proactive attempt to recognize and manage internal events and external threats that affect the likelihood of a project’s success. • What can go wrong (risk event). • How to minimize the risk event’s impact (consequences). • What can be done before an event occurs (anticipation). • What to do when an event occurs (contingency plans).
The Risk Event Graph FIGURE 7.1
Risk Management’s Benefits • A proactive rather than reactive approach. • Reduces surprises and negative consequences. • Prepares the project manager to take advantage of appropriate risks. • Provides better control over the future. • Improves chances of reaching project performance objectives within budget and on time.
Managing Risk • Step 1: Risk Identification • Generate a list of possible risks through brainstorming, problem identification and risk profiling. • Macro risks first, then specific events • Step 2: Risk Assessment • Scenario analysis for event probability and impact • Risk assessment matrix • Failure Mode and Effects Analysis (FMEA) • Probability analysis • Decision trees, NPV, and PERT
Risk Severity Matrix Failure Mode and Effects Analysis (FMEA)Impact × Probability × Detection = Risk Value
Managing Risk (cont’d) • Step 3: Risk Response Development • Mitigating (Reduction) Risk • Reducing the likelihood an adverse event will occur. • Reducing impact of adverse event. • Avoiding Risk • Changing the project plan to eliminate the risk or condition. • Transferring Risk • Paying a premium to pass the risk to another party. • Requiring Build-Own-Operate-Transfer (BOOT) provisions.
Managing Risk con’t. • Controlling Risk • Actions taken to reduce risk likelihood or impact • Actions occur at all points of project • Most common response • Investigating Risk • Defers actions until more work done or facts known • Used where no clear solution is identified • Includes root cause analysis • Retaining (Acceptance) Risk • Making a conscious decision to accept the risk.
Contingency Planning • Contingency Plan • An alternative plan that will be used if a possible foreseen risk event actually occurs. • A plan of actions that will reduce or mitigate the negative impact (consequences) of a risk event. • Risks of Not Having a Contingency Plan • Having no plan may slow managerial response. • Decisions made under pressure can be potentially dangerous and costly.
Risk and Contingency Planning • Technical Risks • Backup strategies if chosen technology fails. • Assessing whether technical uncertainties can be resolved. • Schedule Risks • Use of slack increases the risk of a late project finish. • Imposed duration dates (absolute project finish date) • Compression of project schedules due to a shortened project duration date.
Risk and Contingency Planning (cont’d) • Costs Risks • Time/cost dependency links: costs increase when problems take longer to solve than expected. • Deciding to use the schedule to solve cash flow problems should be avoided. • Price protection risks (a rise in input costs) increase if the duration of a project is increased. • Funding Risks • Changes in the supply of funds for the project can dramatically affect the likelihood of implementation or successful completion of a project.
Managing Risk (cont’d) • Step 4: Risk Response Control • Risk control • Execution of the risk response strategy • Monitoring of triggering events • Initiating contingency plans • Watching for new risks • Establishing a Change Management System • Monitoring, tracking, and reporting risk • Fostering an open organization environment • Repeating risk identification/assessment exercises • Assigning and documenting responsibility for managing risk
Change Management Control • Sources of Change • Project scope changes • Implementation of contingency plans • Improvement changes
Change Control System Process • Identify proposed changes. • List expected effects of proposed changes on schedule and budget. • Review, evaluate, and approve or disapprove of changes formally. • Negotiate and resolve conflicts of change, condition, and cost. • Communicate changes to parties affected. • Assign responsibility for implementing change. • Adjust master schedule and budget. • Track all changes that are to be implemented
Decision Trees And Probability trees
Decision Tree A decision tree is a picture of all the possible courses of action and the consequent possible outcomes. • A box is used to indicate the point at which a decision must be made, • The branches going out from the box indicate the alternatives under consideration
Tree Diagrams A tree diagram is useful for portraying conditional and joint probabilities. It is particularly useful for analyzing business decisions involving several stages. A tree diagramis a graph that is helpful in organizing calculations that involve several stages. Each segment in the tree is one stage of the problem. The branches of a tree diagram are weighted by probabilities.
Probabilities • Marginal • Conditional • Joint • Posterior
Bayes’ Theorem • Bayes’ Theorem is a method for revising a probability given additional information. • It is computed using the following formula: