Exploring Two-Sample Tests in R Through Permutation Testing
Learn about two-sample tests using R, including parametric t-test and nonparametric permutation test, with emphasis on assumptions and permutation principles. Practice included.

Exploring Two-Sample Tests in R Through Permutation Testing
E N D
Presentation Transcript
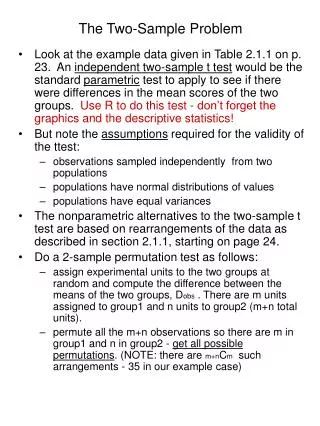
The Two-Sample Problem • Look at the example data given in Table 2.1.1 on p. 23. An independent two-sample t test would be the standard parametric test to apply to see if there were differences in the mean scores of the two groups. Use R to do this test - don’t forget the graphics and the descriptive statistics! • But note the assumptions required for the validity of the ttest: • observations sampled independently from two populations • populations have normal distributions of values • populations have equal variances • The nonparametric alternatives to the two-sample t test are based on rearrangements of the data as described in section 2.1.1, starting on page 24. • Do a 2-sample permutation test as follows: • assign experimental units to the two groups at random and compute the difference between the means of the two groups, Dobs . There are m units assigned to group1 and n units to group2 (m+n total units). • permute all the m+n observations so there are m in group1 and n in group2 - get all possible permutations. (NOTE: there are m+nCm such arrangements - 35 in our example case)
for each of these rearrangements, compute the difference of the means between group1 and group2, call them D • compute the empirical p-value as the number of the D's that exceed the Dobs for your original data divided by the total number of possible rearrangements (this is for a one-sided alternative to the right, others will be similar - see page 27) • make your decision based on this empirical p-value • Now let's think about why this particular method works … • Permutation principle: The distribution of values of the statistic computed for each of the permutations can be used to calculate the p-value and to determine whether a hypothesis should be rejected or not. • Essentially, if the value of your observed statistic is "likely" to have occurred (based on its permutation distribution), then don't reject. If it is "unlikely", then reject… • NOTE: D= T1/m - T2/n = T1/m - (T-T1)/n = T1(1/m + 1/n) - T/n • This implies that D and T1 can be determined from each other… • HW: READ SECTIONS 2.1 AND 2.2 (thru p. 31)- do # 2a on page 73. Write down all 20 permutations!