Examining Confidence in the Legal System: A Logistic Regression Approach
This study investigates the relationship between confidence in the legal system and three independent variables: social class, number of times victimized, and age. Confidence in the legal system is treated as a dichotomous variable, distinguishing between high and low confidence levels. Using logistic regression analysis, the study addresses sample size, data measurement, and nonmetric data handling. The results provide insights into how social status, victimization frequency, and respondent age influence public confidence in legal institutions.

Examining Confidence in the Legal System: A Logistic Regression Approach
E N D
Presentation Transcript
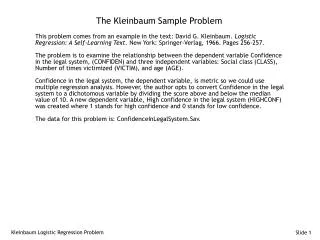
The Kleinbaum Sample Problem This problem comes from an example in the text: David G. Kleinbaum. Logistic Regression: A Self-Learning Text. New York: Springer-Verlag, 1966. Pages 256-257. The problem is to examine the relationship between the dependent variable Confidence in the legal system, (CONFIDEN) and three independent variables: Social class (CLASS), Number of times victimized (VICTIM), and age (AGE). Confidence in the legal system, the dependent variable, is metric so we could use multiple regression analysis. However, the author opts to convert Confidence in the legal system to a dichotomous variable by dividing the score above and below the median value of 10. A new dependent variable, High confidence in the legal system (HIGHCONF) was created where 1 stands for high confidence and 0 stands for low confidence. The data for this problem is: ConfidenceInLegalSystem.Sav. Kleinbaum Logistic Regression Problem
Stage One: Define the Research Problem • In this stage, the following issues are addressed: • Relationship to be analyzed • Specifying the dependent and independent variables • Method for including independent variables Relationship to be analyzed The problem is to examine the relationship between the dependent variable Confidence in the legal system, (CONFIDEN) and three independent variables: Social class (CLASS), Number of times victimized (VICTIM), and age (AGE). Kleinbaum Logistic Regression Problem
Specifying the dependent and independent variables • The dependent variable, High confidence in the legal system (HIGHCONF) was created so that 1 stands for high confidence and 0 stands for low confidence. • The independent variables are: • CLASS 'Social class status' • VICTIM 'Number of times victimized' • AGE 'Age of respondent' • CLASS 'Social class status' is a nonmetric variable with three response options: 1 = Low, 2 = Medium, and 3 = High. While a case could be made that it can be treated as a scale variable, we will treat it as nonmetric and use the SPSS facility in logistic regression to enter it as a categorical variable. • VICTIM 'Number of times victimized' has a range from 0 to 2. Method for including independent variables Since we are interested in the relationship between the dependent variable and all of the independent variables, we will use direct entry of the independent variables. Kleinbaum Logistic Regression Problem
Stage 2: Develop the Analysis Plan: Sample Size Issues • In this stage, the following issues are addressed: • Missing data analysis • Minimum sample size requirement: 15-20 cases per independent variable Missing data analysis There is no missing data in this problem. Minimum sample size requirement: 15-20 cases per independent variable The CLASS 'Social class status' variable has three categories, so dummy coding it will require two variables, bringing the total number of independent variables is 4. The data set has 39 cases and 4 independent variables for a ratio of 10 to 1, falling short of the requirement that we have 15-20 cases per independent variable. Kleinbaum Logistic Regression Problem
Stage 2: Develop the Analysis Plan: Measurement Issues: • In this stage, the following issues are addressed: • Incorporating nonmetric data with dummy variables • Representing Curvilinear Effects with Polynomials • Representing Interaction or Moderator Effects Incorporating Nonmetric Data with Dummy Variables The logistic regression procedure will dummy code the nonmetric variables for us. Representing Curvilinear Effects with Polynomials We do not have any evidence of curvilinear effects at this point in the analysis. Representing Interaction or Moderator Effects We do not have any evidence at this point in the analysis that we should add interaction or moderator variables. Kleinbaum Logistic Regression Problem
Stage 3: Evaluate Underlying Assumptions • In this stage, the following issues are addressed: • Nonmetric dependent variable with two groups • Metric or dummy-coded independent variables Nonmetric dependent variable having two groups The dependent variable HIGHCONF 'High confidence in legal system' is a dichotomous variable. Metric or dummy-coded independent variables The independent variable CLASS 'Social class status' is nonmetric and will be recoded into two dichotomous variables automatically using an SPSS option for designating an independent variable as categorical. The independent variables VICTIM 'Number of times victimized' and AGE 'Age of respondent' are metric variables. Kleinbaum Logistic Regression Problem
Stage 4: Estimation of Logistic Regression and Assessing Overall Fit: Model Estimation • In this stage, the following issues are addressed: • Compute logistic regression model Compute the logistic regression The steps to obtain a logistic regression analysis are detailed on the following screens. Kleinbaum Logistic Regression Problem
Requesting a Logistic Regression Kleinbaum Logistic Regression Problem
Specifying the Dependent Variable Kleinbaum Logistic Regression Problem
Specifying the Independent Variables Kleinbaum Logistic Regression Problem
Specify the Categorical Independent Variable Kleinbaum Logistic Regression Problem
Specify the method for entering variables Kleinbaum Logistic Regression Problem
Specifying Options to Include in the Output Kleinbaum Logistic Regression Problem
Specifying the New Variables to Save Kleinbaum Logistic Regression Problem
Complete the Logistic Regression Request Kleinbaum Logistic Regression Problem
Stage 4: Estimation of Logistic Regression and Assessing Overall Fit: Assessing Model Fit • In this stage, the following issues are addressed: • Significance test of the model log likelihood (Change in -2LL) • Measures Analogous to R²: Cox and Snell R² and Nagelkerke R² • Hosmer-Lemeshow Goodness-of-fit • Classification matrices • Check for Numerical Problems • Presence of outliers Categorical variable recoding At the start of the output, SPSS reports how it dummy coded the variable CLASS 'Social class status': SPSS does not assign new names to the dummy coded variable, instead it will refer to the variables as CLASS(1) and CLASS(2). CLASS(1) corresponds to Lower Class; CLASS(2) corresponds to Middle Class, and Upper Class is the omitted category. Kleinbaum Logistic Regression Problem
Initial statistics before independent variables are included The Initial Log Likelihood Function, (-2 Log Likelihood or -2LL) is a statistical measure like total sums of squares in regression. If our independent variables have a relationship to the dependent variable, we will improve our ability to predict the dependent variable accurately, and the log likelihood value will decrease. The initial –2LL value is 54.040 on step 0, before any variables have been added to the model. Kleinbaum Logistic Regression Problem
Significance test of the model log likelihood The difference between these two measures is the model child-square value (17.863 = 54.040 – 36.177) that is tested for statistical significance. This test is analogous to the F-test for R² or change in R² value in multiple regression which tests whether or not the improvement in the model associated with the additional variables is statistically significant. In this problem the model Chi-Square value of 17.863 has a significance of 0.001, less than 0.05, so we conclude that there is a significant relationship between the dependent variable and the set of independent variables. Kleinbaum Logistic Regression Problem
Measures Analogous to R² The next SPSS outputs indicate the strength of the relationship between the dependent variable and the independent variables, analogous to the R² measures in multiple regression. The relationship between the dependent variable and independent variables is strong, indicated by the value of Nagelkerke R^2 which is 0.490. Using the interpretive criteria for R², we would characterize this relationship as strong. Kleinbaum Logistic Regression Problem
Correspondence of Actual and Predicted Values of the Dependent Variable The final measure of model fit is the Hosmer and Lemeshow goodness-of-fit statistic, which measures the correspondence between the actual and predicted values of the dependent variable. In this case, better model fit is indicated by a smaller difference in the observed and predicted classification. A good model fit is indicated by a nonsignificant chi-square value. The goodness-of-fit measure has a value of 5.507 which has the desirable outcome of nonsignificance. Kleinbaum Logistic Regression Problem
The Classification Matrices The classification matrices in logistic regression serve the same function as the classification matrices in discriminant analysis, i.e. evaluating the accuracy of the model. If the predicted and actual group memberships are the same, i.e. 1 and 1 or 0 and 0, then the prediction is accurate for that case. If predicted group membership and actual group membership are different, the model "misses" for that case. The overall percentage of accurate predictions (71.8% in this case) is the measure of a model that I rely on most heavily for this analysis as well as for discriminant analysis because it has a meaning that is readily communicated, i.e. the percentage of cases for which our model predicts accurately. To evaluate the accuracy of the model, we compute the proportional by chance accuracy rate and the maximum by chance accuracy rates, if appropriate. The proportional by chance accuracy rate is equal to 0.500 (0.487^2 + 0.513^2). A 25% increase over the proportional by chance accuracy rate would equal 0.625. Our model accuracy race of 71.79% exceeds this criterion. With 51% of the cases in one group and 49% of the cases in the other group, we do not have a dominant category that would require us to compare our results to the maximum by chance accuracy rate.
The Stacked Histogram SPSS provides a visual image of the classification accuracy in the stacked histogram as shown below. To the extent to which the cases in one group cluster on the left and the other group clusters on the right, the predictive accuracy of the model will be higher. As we can see in this plot, there is some overlapping between the two groups.
Check for Numerical Problems There are several numerical problems that can in logistic regression that are not detected by SPSS or other statistical packages: multicollinearity among the independent variables, zero cells for a dummy-coded independent variable because all of the subjects have the same value for the variable, and "complete separation" whereby the two groups in the dependent event variable can be perfectly separated by scores on one of the independent variables. All of these problems produce large standard errors (over 2) for the variables included in the analysis and very often produce very large B coefficients as well. If we encounter large standard errors for the predictor variables, we should examine frequency tables, one-way ANOVAs, and correlations for the variables involved to try to identify the source of the problem. The standard errors and B coefficients are not excessively large, so there is no evidence of a numeric problem with this analysis. Kleinbaum Logistic Regression Problem
Presence of outliers There are two outputs to alert us to outliers that we might consider excluding from the analysis: listing of residuals and saving Cook's distance scores to the data set. SPSS provides a casewise list of residuals that identify cases whose residual is above or below a certain number of standard deviation units. Like multiple regression there are a variety of ways to compute the residual. In logistic regression, the residual is the difference between the observed probability of the dependent variable event and the predicted probability based on the model. The standardized residual is the residual divided by an estimate of its standard deviation. The deviance is calculated by taking the square root of -2 x the log of the predicted probability for the observed group and attaching a negative sign if the event did not occur for that case. Large values for deviance indicate that the model does not fit the case well. The studentized residual for a case is the change in the model deviance if the case is excluded. Discrepancies between the deviance and the studentized residual may identify unusual cases. (See the SPSS chapter on Logistic Regression Analysis for additional details). In the output for our problem, SPSS informs us that there is one outlier in this analysis: Kleinbaum Logistic Regression Problem
Cook’s Distance SPSS has an option to compute Cook's distance as a measure of influential cases and add the score to the data editor. I am not aware of a precise formula for determining what cutoff value should be used, so we will rely on the more traditional method for interpreting Cook's distance which is to identify cases that either have a score of 1.0 or higher, or cases which have a Cook's distance substantially different from the other. The prescribed method for detecting unusually large Cook's distance scores is to create a scatterplot of Cook's distance scores versus case id. Kleinbaum Logistic Regression Problem
Request the Scatterplot Kleinbaum Logistic Regression Problem
Specifying the Variables for the Scatterplot Kleinbaum Logistic Regression Problem
The Scatterplot of Cook's Distances On the plot of Cook's distances shown below, we see no cases that exceed the 1.0 rule of thumb for influential cases. We do, however, identify cases that have relatively larger Cook's distance values (above 0.6) than the majority of cases. However, with the small sample size we have in this problem, I am not inclined to remove any cases unless they were extreme outliers or influential cases. Kleinbaum Logistic Regression Problem
Stage 5: Interpret the Results • In this section, we address the following issues: • Identifying the statistically significant predictor variables • Direction of relationship and contribution to dependent variable Kleinbaum Logistic Regression Problem
Identifying the statistically significant predictor variables The coefficients are found in the column labeled B, and the test that the coefficient is not zero, i.e. changes the odds of the dependent variable event is tested with the Wald statistic, instead of the t-test as was done for the individual B coefficients in the multiple regression equation. As shown above, only the variables VICTIM 'Number of times victimized' and AGE 'Age of respondent' have a statistically significant individual relationship with the dependent variable. Kleinbaum Logistic Regression Problem
Direction of relationship and contribution to dependent variable The predictor variable with the strongest relationship is VICTIM. The negative sign of the B coefficient and the value of Exp(B) less than 1.0 both indicate that the relationship is inverse: the more times one is victimized, the less likely one is to have confidence in the legal system. With the inverse relationship, it may make more sense to invert the odds ratio (1 / odds ratio) and interpret the probability of not belonging to the dependent variable group assigned the code of 1. In this problem, we could say that every time a person is victimized, they are 4.2 times less likely to have high confidence in the legal system (1/.236 = 4.2). Age has a direct relationship with confidence in the legal system: as one gets older, one's confidence in the legal system increases. For every 1 year increase in age, the odds of having high confidence in the legal system increase 1.2 times. Kleinbaum Logistic Regression Problem
Stage 6: Validate The Model • When we have a small sample in the full data set as we do in this problem, a split half validation analysis is almost guaranteed to fail because we will have little power to detect statistical differences in analyses of the validation samples. In this circumstance, our alternative is to conduct validation analyses with random samples that comprise the majority of the sample. • We will demonstrate this procedure in the following steps: • Computing the First Validation Analysis • Computing the Second Validation Analysis • The Output for the Validation Analysis Computing the First Validation Analysis We set the random number seed and modify our selection variable so that is selects about 75-80% of the sample. Kleinbaum Logistic Regression Problem
Set the Starting Point for Random Number Generation Kleinbaum Logistic Regression Problem
Compute the Variable to Select a Large Proportion of the Data Set Kleinbaum Logistic Regression Problem
Specify the Cases to Include in the First Validation Analysis Kleinbaum Logistic Regression Problem
Specify the Value of the Selection Variable for the First Validation Analysis Kleinbaum Logistic Regression Problem
Computing the Second Validation Analysis We reset the random number seed to another value and modify our selection variable so that is selects about 75-80% of the sample. Kleinbaum Logistic Regression Problem
Set the Starting Point for Random Number Generation Kleinbaum Logistic Regression Problem
Compute the Variable to Select a Large Proportion of the Data Set Kleinbaum Logistic Regression Problem
Specify the Cases to Include in the Second Validation Analysis Kleinbaum Logistic Regression Problem
Specify the Value of the Selection Variable for the Second Validation Analysis Kleinbaum Logistic Regression Problem
Generalizability of the Logistic Regression Model We can summarize the results of the validation analyses in the following table. It is difficult to do a validation analysis with such a small sample in the full model. Based on the evidence, we cannot conclude that the model is generalizable because none of the independent variables appear in both of the validation analyses and the accuracy rate for the validation sample in the first validation analysis drops substantially. If we still believed the model was of value, we need to find an opportunity to validate the findings against another sample. Kleinbaum Logistic Regression Problem