Chapter 3 Consumer Choice
Chapter 3 Consumer Choice. Chapter Outline. Preferences. Utility. Budget Constraint. Constrained Consumer Choice. Behavioral Economics. Premises of Consumer Behavior. The model of consumer behavior is based on the following premises:


Chapter 3 Consumer Choice
E N D
Presentation Transcript
Chapter Outline • Preferences. • Utility. • Budget Constraint. • Constrained Consumer Choice. • Behavioral Economics.
Premises of Consumer Behavior The model of consumer behavior is based on the following premises: • Individual preferences determine the amount of pleasure people derive from the goods and services they consume. • Consumers face constraints or limits on their choices. • Consumers maximize their well-being or pleasure from consumption, subject to the constraints they face.
Five Properties of Consumer Preferences • Completeness - when facing a choice between any two bundles of goods, a consumer can rank them so that one and only one of the following relationships is true: The consumer prefers the first bundle to the second, prefers the second to the first, or is indifferent between them.
Five Properties of Consumer Preferences • Transitivity – a consumer’s preferences over bundles is consistent in the sense that, if the consumer weakly prefers Bundle z to Bundle y (likes z at least as much as y) and weakly prefers Bundle y to Bundle x, the consumer also weakly prefers Bundle z to Bundle x.
Five Properties of Consumer Preferences • More Is Better - all else being the same, more of a commodity is better than less of it (always wanting more is known as nonsatiation). • Good - a commodity for which more is preferred to less, at least at some levels of consumption • Bad - something for which less is preferred to more, such as pollution Concentrate on goods
Five Properties of Consumer Preferences • Continuity- if a consumer prefers Bundle a to Bundle b, then the consumer prefers Bundle c to b is c is very close to a. • The purpose of this assumption is to rule out sudden preference reversals in response to small changes in the characteristics of a bundle
Five Properties of Consumer Preferences • Strict Convexity- means that consumers prefer averages to extremes, i.e. more balanced baskets that have some of each good. • For example if Bundle a and Bundle b are distinct bundles and the consumer prefers both of these bundles to Bundle c, then the consumer prefers a weighted average of a and b, βa+(1-β)b, to Bundle c.
Preference Maps • To summarize information about a consumer’s preferences is to create a graphical representation- a map-of them • Example: Each semester, Lisa, who lives for fast food, decides how many pizzas and burritos to eat. • The various bundles of pizzas and burritos she might consume are shown in panel a of Figure 3.1
Figure 3.1 Bundles of Pizzas and Burritos Lisa Might Consume Which of these two bundles would be preferred by Lisa? Lisa prefers any bundle in area A over e Which of these two bundles would be preferred by Lisa? (a) (b) A c c 25 25 itos per semester itos per semester f 20 20 Lisa prefers bundle e over bundle d, since e has more of both goods: Pizza and Burritos Lisa prefers bundle f over bundle e, since f has more of both goods: Pizza and Burritos r r e 15 15 , Bur , Bur e a a B B d 1 10 10 I b b 5 B 15 25 30 15 25 30 Z , Pizzas per semester Z , Pizzas per semester If Lisa is indifferent between bundles e, a, and c ….. Lisa prefers bundle e to any bundle in area B we can draw an indifferent curve over those three points
Indifference Curves • Indifference curve - the set of all bundles of goods that a consumer views as being equally desirable. • The figure shows indifference curves that are continuous (have no gaps). • Indifference map - a complete set of indifference curves that summarize a consumer’s tastes or preferences
Properties of Indifference Maps • Bundles on indifference curves farther from the origin are preferred to those on indifference curves closer to the origin. (more is better) • There is an indifference curve through every possible bundle. • Indifference curves cannot cross. • Indifference curves slope downward. • Indifference curves can not be thick.
Figure 3.1 Bundles of Pizzas and Burritos Lisa Might Consume (a) (c) A c c 25 25 f f itos per semester itos per semester 20 20 I2 e 15 15 r r e a a , Bur , Bur d d B B 1 10 10 I b 5 I0 B 15 25 30 15 25 30 Z , Pizzas per semester Z , Pizzas per semester we can draw an indifferent curve over those three points
Fig 3.2 Impossible Indifference Curves • Lisa is indifferent between e and a, and also between e and b… • so by transitivity she should also be indifferent between a and b… • but this is impossible, since b must be preferred to a given it has more of both goods. ( More-is-better) itos per semester r , Bur B e b 1 I a 0 I Indifference curves can not cross: A given bundle cannot be on two indifference curves Z , Pizzas per semester
Therefore, indifference curves must slope downward to the right • If they sloped upward, they would violate the assumption that more is preferred to less • Some points that had more of both goods would be indifferent to a basket with less of both goods • To consume more food, the consumer is willing to give up some units of clothing consumption and still get the same utility. In other words, if food consumption is decreased, the consumer needs to obtain more units of clothing to keep the same level of utility.
Impossible Indifference Curves • Lisa is indifferent between b and a since both points are in the same indifference curve… • But this contradicts the “more is better” assumption. Can you tell why? • Yes, b has more of both and hence it should be preferred over a. itos per semester b r , Bur B a I Z , Pizzas per semester
Solved Problem 3.1 • Can indifference curves be thick? • Answer: • Draw an indifference curve that is at least two bundles thick, and show that a preference property is violated
Solved Problem 3.1 • Consumer is indifferent between b and a since both points are in the same indifference curve… • But this contradicts the “more is better” assumption since b has more of both and hence it should be preferred over a. itos per semester r b , Bur a B I Z , Pizzas per semester
Utility • Utility - a set of numerical values that reflect the relative rankings of various bundles of goods. • utility function - the relationship between utility values and every possible bundle of goods. U(B, Z)
Consumer Preferences • Utility • A numerical score representing the satisfaction that a consumer gets from a given market basket • If buying 3 copies of Microeconomics makes you happier than buying one shirt, then we say that the books give you more utility than the shirt
Utility Function: Example • Suppose that the utility Lisa gets from pizzas and burritos is • Question: Can we determine whether Lisa would be happier if she had Bundle x with 9 burritos and 16 pizzas or Bundle y with 13 of each? • Answer: The utility she gets from x is 12utils. The utility she gets from y is 13utils. Therefore, she prefers y to x.
Utility • Although we numerically rank baskets and indifference curves, numbers are ONLY for ranking • A utility of 4 is not necessarily twice as good as a utility of 2 • There are two types of rankings • Ordinal ranking • Cardinal ranking
Ordinal Preferences • If we know only consumers’ relative rankings of bundles, our measure of pleasure is ordinal rather than cardinal • An ordinal measure is one that tells us the relative ranking of two things but does not tell us how much more one rank is than another • A cardinal measure is one by which absolute comparisons between ranks may be made Utility measures are not unique
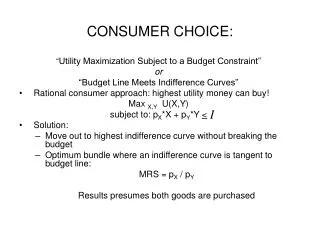
Willingness to Substitute between goods • Marginal Rate of Substitution- maximum amount of one good that a consumer will sacrifice (trade) to obtain one more unit of another good Slope of the indifference curve • Indifference curve is downward sloping, hence a negative MRS • We will use calculus to determine MRS at a point on Lisa’s indifference curve
Marginal Rate of Substitution MRS at e = - slope of indifference curve at e = - dB/dP =-dq2/dq1
Clothing 15 C 10 U3 = 100 A 5 B U2 = 50 U1 = 25 Food 0 5 10 15 Utility - Example Basket U = FC C 25 = 2.5(10) A 25 = 5(5) B 25 = 10(2.5)
Marginal Utility • MRS depends on how much extra utility Lisa gets from a little more of each good • marginal utility - the extra utility that a consumer gets from consuming the last unit of a good. • the slope of the utility function as we hold the quantity of the other good constant. • Lisa’s utility function is:
Utility and Marginal Utility As Lisa consumes more pizza, holding her consumption of burritos constant at 10, her total utility, U, increases… and her marginal utility of pizza, MUZ, decreases (though it remains positive). Marginal utility is the slope of the utility function as we hold the quantity of the other good constant. (a) Utility 350 Utility function, U (10, Z ) , Utils U 250 DU = 20 230 DZ = 1 0 1 2 3 4 5 6 7 8 9 10 Z , Pizzas per semester (b) Marginal Utility 130 , Marginal utility of pizza Z MU 20 MU Z 0 1 2 3 4 5 6 7 8 9 10 Z , Pizzas per semester
(a) MRS along an Indifference curve Indifference Curve Convex to the Origin • The MRS from bundle a to bundle b is -3. • This is the same as the slope of the indifference curve between those two points. • From b to c, • MRS = -2. • This is the same as the slope of the indifference curve between those two points. From bundle a to bundle b, Lisa is willing to give up 3 Burritos in exchange for 1 more Pizza… a 8 itos per semester –3 r b From bundle c to bundle d, Lisa is willing to give up 1 Burritos in exchange for 1 more Pizza… 5 , Bur 1 B -2 c 3 1 d -1 2 1 I 0 3 4 5 6 Z , Pizzas per semester
Marginal Rate of Substitution • Indifference curves are typically convex (bowed inward). • As more of one good is consumed, a consumer would prefer to give up fewer units of a second good to get additional units of the first one (property of diminishing MRS) • In other words, consumers generally prefer a balanced market basket
Marginal Rate of Substitution • The MRS decreases as we move down the indifference curve • Along an indifference curve there is a diminishing marginal rate of substitution. • The MRS went from 3 to 2 to 1
Diminishing MRS along an Indifference curve 4-33 Indifference Curve Convex to the Origin At point a, the consumer has many units of burritos and few units of pizza and therefore, it is reasonable to assume that s/he may value pizza relatively more than burritos: s/he would give up a lot of burritos (3 units) to obtain 1 additional unit of pizza and still be able to keep the same level of utility. a 8 itos per semester –3 r b 5 , Bur 1 However, at point c, s/he has few burritos and a lot of pizza. She’s only willing to give up a small amount of burritos for an additional unit of pizza, making the slope very flat. Therefore, it is reasonable to assume that MRS diminishes as we move down the indifference curve. B -2 c 3 1 d -1 2 1 I 0 3 4 5 6 Z , Pizzas per semester
(b) Marginal Rate of Substitution with concave indifference curves (b) Indif f erence Cu r v e Conc a v e to the O r igin • From bundle a to bundle b, Lisa is willing to give up 2 Pizzas for 1 Burrito. • Nevertheless, from b to c she is willing to give up 3 Pizzas for 1 burrito. • This is very unlikely • Could you think why? itos per semester a 7 – 2 r b 5 , Bur 1 B – 3 c 2 1 I 0 3 4 5 6 Z , Pizzas per semester
Diminishing marginal rate of substitution • When we have CONVEX preferences (as in the normal case) The marginal rate of substitution approaches zero as we move down and to the right along an indifference curve. • Discussion: could you imagine a good that does not exhibit this property?
Exercise: Suppose that utility function of a consumer is give by U(F,C)= FC. • Draw the indifference curve associated with a utility level of 12 and the indifference curve associated with the utility level of 24. • Show that the indifference curves are convex. Use indifference curve for utility level 12 as an example to show this. • Find the equation for the indifference curve for utility level equal to 12 and find the MRS at (F,C) = (3,4). • Find the MRS at point (F,C) = (2,3). You will have to derive the equation for indifference curve that goes through the point first, then find the MRS at that point.
Willingness to Substitute between goods Suppose more generally we have an indifference curve: Then once we select a value for q1, then the point q2 is determined by the equation of the indifference curve, so we can write q2 as a function of q1, i.e. q2(q1) (Example: U=FC; For utility=25, indifference curve is FC=25, or C=25/F) Where U1 is MU of good 1
Marginal Utility and Consumer Choice • It must be the case along an indifference curve that No change in total utility along an indifference curve. Trade off of one good to the other leaves the consumer just as well off.
Marginal Utility and Consumer Choice • Rearranging:
Solved Problem 3.2 Suppose that Jackie has what is known as a Cobb-Douglas utility function: where a is a positive constant, q1 is the number of CDs she buys a year and q2 is the number of movie DVDs she buys. What is her MRS? Answer:
Curvature of Indifference Curves. • Casual observation suggests that most people’s indifference curves are convex. • Exceptions: • Perfect substitutes - goods that a consumer is completely indifferent as to which to consume. • Perfect complements - goods that a consumer is interested in consuming only in fixed proportions
Figure 3.4a Perfect Substitutes • Bill views Coke and Pepsi as perfect substitutes: can you tell how his indifference curves would look like? • Straight, parallel lines with an MRS (slope) of −1. • Bill is willing to exchange one can of Coke for one can of Pepsi. eek 4 w 3 , Cans per e 2 k Co 1 1 2 3 4 I I I I 0 1 2 3 4 P epsi, Cans per w eek
Figure 3.4b Perfect Complements • If she has only one piece of pie, she gets as much pleasure from it and one scoop of ice cream, a, • as from it and two scoops, d, • or as from it and three scoops, e. eek w c e 3 3 I b d Ice cream, Scoops per 2 2 I a 1 1 I 0 1 2 3 Pi e , Slices per w eek
EXERCISE • Suppose a consumer’s utility of consuming good-X and good-Y is given by U(X,Y) = min{X,2Y} • Where, X is the amount of good-X and Y is the amount of good-Y. The function “min” is a function that chooses the smallest value in the bracket. For example min{2,3} =2, min(3,2}=2, min{100,3} =3.
Figure 3.4c Imperfect Substitutes • The standard-shaped, convex indifference curve in panel lies between these two extreme examples. • Convex indifference curves show that a consumer views two goods as imperfect substitutes. f itos per semester r , Bur B I Z , Pizzas per semester
Application: Indifference Curves Between Food and Clothing Research has shown that at low (subsistence) levels of income (I1), there is little willingness to substitute between food and clothing.
Consumer Preferences: An Application • An analysis of consumer preferences would help to determine where to spend more on changes in car design: performance or styling • Some consumers will prefer better styling and some will prefer better performance in their car
Styling Performance Consumer Preferences: An Application These consumers place a greater value on performance than styling
Styling Performance Consumer Preferences: An Application These consumers place a greater value on styling than performance
Problems: constructing indifference curves • Don is altruistic. Show the possible shape of his indifference curves between charity and all other goods. • Miguel considers tickets to the Houston Grand Opera and to Houston Astros baseball games to be perfect substitutes. Show his preference map. • If Joe views two candy bars and one piece of cake as perfect substitutes, what is his marginal rate of substitution between candy bars and cake?