Download
1 / 21
210 likes | 685 Vues
LCD vs CRT Energy Consumption A Market Study Prepared for Dell Computer by Mark Fihn DisplaySearch October 29, 2001 What Others Are Saying… Photon Dynamics Presents to White House

E N D
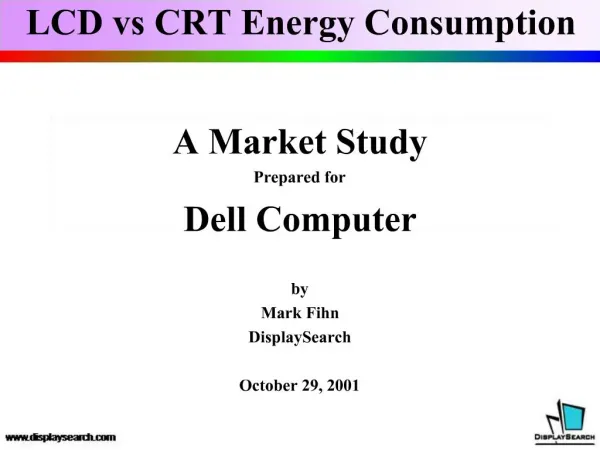
LCD vs CRT Energy Consumption A Market Study Prepared for Dell Computer by Mark Fihn DisplaySearch October 29, 2001
Photon Dynamics Presents to White House Photon Dynamic’s VP of Marketing, Bruce Delmore, advises President Bush about the energy advantages of flat panel monitors. Photon Dynamics’ demonstrated to President Bush on two separate occasions regarding the difference in energy consumption between a 17.0” LCD monitor versus a 19.0” CRT monitor by attaching power meters displaying watt usage. The difference in power consumption was dramatic, 73 watts. LCDs typically use approximately 30% of the power of similar CRTs. "Research shows that LCDs use about 74 percent less electricity and space, than their CRT predecessors, while reducing eye-strain and heat load," said Sollitto. "With more than 50 million CRTs in California, the state could save up to $1 billion a year or almost 5 billion kilowatt hours of its total electricity use if only half of the CRTs were replaced with LCDs," he added.
State of California Analysis • Supply - California has the ability to generate 55.5 billion watts of power and can import another eight million watts per day. Actual capacity appears to be around 45 billion watts due to transmission losses and some plants not fully operational. For more info, see www.cpuc.ca.gov/published/report/GOV_REPORT.htm. • Demand - Peak energy demand in California in the winter is 45.5 billion watts while summer 2000 demand reached 53 billion watts. For more information on California's energy demand, see www.energy.ca.gov/electricity/commission_demand_forecast.htm. • Population - 33.145 million people according to the 1999 census. • Number of CRTs per Person – Estimated at 1.5. Includes TVs monitors, public displays, ATMs, etc., so that the number of CRTs in California is estimated at 49.7 million. • Watts per CRT - Estimated at 115. Depends on size, brightness, etc. • Watts per LCD Monitor - Estimated at 35. Also depends on size, brightness, LCD mode, etc. • Watts Consumed By CRTs - 5.72 billion Watts. • Watts Consumed if All CRTs Replaced By LCDs - 1.74 billion Watts • Power Savings from Migrating to LCDs -3.98 billion Watts. The four billion Watt reduction would solve many of California's energy problems by reducing power consumption by 9%. It would avoid blackouts and Stage 1, 2 and 3 alerts, which are defined as statewide power reserves falling below 7%, 5% and 1.5%. The four billion Watts is approximately equal to the combined output of all nuclear power plants in California and could power four million homes. • Price per kW/hr - $0.10 - $0.30 depending on time, type, etc. Photon Dynamics assumes $0.12 on average. Price per W/hr would then be $0.00012. • Cost Savings Per Day - Assuming monitors are operated for eight hours per day, cost savings would be $3.8 million per day or $1.4 trillion per year. • Percentage of Power Consumed by CRTs - Based on Charles' assumptions, CRTs consume 12.6% of the power produced in California. -- Analysis from Charles Annis, Photon Dynamics
Sandia National Labs Study A recent study by Fred Cohen at the Sandia National Laboratories was conducted to solve a practical problem of determining how to get 250 computers operational in a very small area and with a limited total power capability. The office situation meant that not all of the computers could be on at the same time, meaning that different projects had to be scheduled for different times. Moreover, since system turn-on transients use more energy than when the devices operate at a steady state, meaning that a schedule had to be created to turn on/off computers appropriately. The team at Sandia solved the problems by creating a database of the power consumption and turn on transient power consumption for every device in the laboratory. The database was then used to determine how many of what kinds of computers could most efficiently go on each circuit and to schedule power up sequences associated with the different devices. Interestingly, the creation and implementation of the Sandia database identified some fascinating global consequences related to energy consumption. First of all, the team discovered that salvaging and upgrading older computers in order to reduce computer expense budgets did not always actually save money. According to Dr. Cohen, “We would take an 8 year old display and attach a $10 connector to get a working unit for next to nothing, but the power consumption was higher than a more recent display, so we were ending up paying more for electricity than we other wise would have had to”. But it gets worse. The more energy required for a computer system, the more heat that is generated, which increases air conditioning loads. An additional side effect of higher temperatures is a more rapid degradation of computing devices resulting in shorter lifetimes and more failures. As reported by Dr. Cohen, “Every watt of power you save in computer energy, you save again several times over in air conditioning cost…Since almost all of the energy used by computers goes to heat, we have to pay for the power we use in computers twice; once for their use and once for the removal of their resultant heat”. Although Fred Cohen’s study evaluated all computer equipment, the most telling results related to their calculations comparing CRT monitors and LCD monitors. The study indicated that the power consumption for a flat panel monitor is about 1/5 the power consumption of a typical CRT monitor.
Electronics Industry of Japan Study The higher energy costs have been used by Japanese LCD monitor brands as a means to promote LCD monitors since the infancy of the LCD monitor market due to much higher energy costs in Japan. In a study by the Electronics Industry Association of Japan in early 1999, it was shown that the average cost of operation of a 15" LCD monitor over a 5-year period was lower than an average 17" CRT monitor due to 80% lower electricity costs, 75% lower cooling equipment costs and 58% lower space costs. The biggest savings in their study were from the space costs with energy costs accounting for just 8% of the total operating cost of a 17" CRT. Nonetheless, the EIAJ study showed that if 50% of Japan's CRT monitors were converted to LCDs, four power plants and 181,000 tons of CO 2 emissions could be eliminated.
Comparison of IBM Monitors A quick comparison of IBM’s various monitor products easily shows the substantially lower power consumption associated with TFT LCDs. Even at 200 pixel/inch, the industry’s highest performance TFT LCD monitor, the T221 consumes the same amount of energy as a high-end Trinitron CRT Monitor. This is significant since the T221 offers a 12% increase in diagonal size, and 480% more information content. In other words, the viewable information on the T221 would require more than 5 of the Trinitron monitors. • * = Trinitron models • From IBM’s website, October 28, 2001 • IBM was chosen as an example due to their website’s • simple power consumption reporting viewable across • both TFT LCD and CRT Monitors.
Energy Factors, LCD vs. CRT • Higher electricity costs of CRTs • Apples-to-apples comparisons are difficult, since TFT LCD monitors and CRT monitors have many different performance parameters, both between the two technologies and within the same technology. And many cost factors are independent from the display technology, (styling, speakers, analog/digital, interface, etc). In general, CRT monitors consume about 2.2 times more energy than an “equivalent” TFT LCD monitor. • Higher cooling costs to maintain the desired room temperature of operating CRTs • The “extra” energy required to power a CRT monitor must “go” somewhere – and its generally dissipated as heat into the surrounding room environment. This typically translates to a need for additional air conditioning. Even in a home environment, the extra heat must be cooled and will require some additional air conditioning. In office environments, the added heat can be considerable. • Lower heating costs to maintain the desired room temperature of operating CRTs • Conversely, in cold climates, excess heat generated by CRTs may help to reduce heating bills. But following this logic would lead people to leave their CRTs on even overnight – clearly an expensive method of heating. And since most utility companies reduce winter-time rates, the cost of ownership factors still favor LCDs throughout the year.
Energy Factors, LCD vs. CRT • Higher power equipment source and installation costs of operating CRTs • In some high display-count environments where many devices crowd a small area, (financial trading centers, control rooms, densely populated offices, etc), the heat dissipation from CRT monitors cannot be handled by simply running existing air conditioning systems more or turning down the thermostat, but require entirely new or additional air conditioning systems. Particularly in high-rise office buildings, installation of such new systems can be exorbitantly expensive. • Higher cost of energy in the LCD production process • Energy costs associated with TFT LCD fabs are higher (when translated to a unit basis), than those for a CRT production facility, by approximately 3X. This fact leads some observers to suggest that savings associated with switching from LCD to CRT are much less significant – and that TFT LCD energy costs simply come earlier in the product lifetime. Two problems with this suggestion. First the energy costs attributed to each LCD is only a few dollars – much less than the ongoing costs of operating one. Second, this analysis forgets the huge energy costs associated with the production of glass – much higher costs for CRT glass tubes than for TFT LCD substrates. According to officials from Sharp Corporation, the energy costs associated with the production of LCDs and CRTs favor CRTs only when considering “equal” sizes, and then only slightly. Since CRTs tend to be much bigger than TFT LCDs, on average, the per unit energy costs to make CRTs are actually much higher. And these costs really are due to differential energy rates in Japan/Korea/Taiwan (where TFT LCD are manufactured) and China, (where CRT tubes are primarily manufactured).
Energy Factors, LCD vs. CRT • Increased desktop real estate costs of CRTs • The thin form-factor of an TFT LCD monitor reduces the necessary desk space needed for workers. Roughly, a CRT monitor requires 2.4X larger footprint. This space can be removed from the office layout, thereby saving rental (and energy) costs. Considering wall- mount versions, TFT LCD monitors can even save more space by creating a workable surface under the display. • Shorter useful life of CRTs • Due to half-life issues associated with the CRT’s phosphors, TFT LCDs are expected to have longer life-spans. Typical estimates are that a CRT has a useful lifespan of 4-5 years, while a TFT LCD monitor will have a lifespan of 6-7 years. • Additionally, due to their higher up-front cost, buyers are more likely to employ surge protection for their TFT LCD monitors, helping to avoid replacement/repair incidents. • Higher costs of transportation of CRTs • Due to their larger size and weight, CRTs cost more to transport, (which in part is an energy related factor). Most buyers do not factor in freight to the overall acquisition cost – particularly important for the direct sales channel. • Higher costs of CRT disposal • CRT monitors are bulkier and more difficult to dispose of, which has an additional environmental and economic impact. It’s uncertain how to calculate any related costs.
Energy Factors, LCD vs. CRT • Comparative readability and other human factors • Considerable research has consistently demonstrated various human factors favoring the usage of LCDs vs CRTs, particularly in terms of worker productivity. Measuring the economic value of such factors, however, is very difficult. Advantages include: • Faster word recognition • Faster word comprehension • Fewer head turns • Reduced scrolling • Reduced eyestrain • Ease of shifting to portrait mode • These advantages will improve worker productivity – translating to additional economic advantages, and perhaps to further energy savings. If workers can work faster and accomplish the same amount of work in a shorter period of time, it will reduce such things as overtime pay, after-hours energy-related expenses, and even legal expenses related to claims for eyestrain, etc. • There is also a strong argument that enhanced readability on-screen, as provided by TFT LCD monitors will reduce printing expenses and associated energy costs. • Some of these advantages are reviewed in the following pages.
Search Time By Display Technology Source: Dr. Martina Ziefle, Technical University of Aachen, Germany, DisplaySearch High Resolution Symposium 2001.
LCD vs. CRT Higher Productivity 15.0” UXGA 22 words 15.0” XGA 12 words Better Word Comprehension 18” Viewing Distance Word Recognition Wright, S.L., et. al. (1999) SID’99 Digest, 346-349.
LCD vs. CRT Higher Productivity A 15° eye movement is generally accompanied by a head turn. Using this rule you can estimate the number of head turns required to scan a screen width from an eye point 18 inches away. Reduced Head Turns 8.5 x 11.0” paper requires no head turns. Paperback books are sized to minimize head turns… • 21” UXGA CRT: 4 head turns • 15” UXGA TFT: 3 head turns • 15.0” TFT vs. 21.0” CRT offers: • Same information content • Better visual clarity • Smaller footprint • Higher Worker Productivity Higher dot pitches mean smaller display diagonals. This means fewer head motions and stiff necks. Based on research from NASA Ames Research Center
LCD vs. CRT Higher Productivity Reduced Scrolling • -- High resolution reduces scrolling substantially. • -- Reduced scrolling results in: • Reduced Printing Expenses • Reduced On-line Wait Times (and related expenses) • Better On-line “hit” Utilization • (If the user needs to scroll extensively through an on-line store in order to find items – especially the “buy” button -- the buying experience is diminished and sales are potentially lost). • Higher resolution graphics will result in more realistic viewing on web-sites. • (The buyer will be able to better see what’s offered). • -- Needed: 3rd Party Study related to the negative impact of scrolling.
Reduced Scrolling 800x600 1600x1200 LCD Pixel Density Advantage 1024x768 • Note: 800x600 requires five down-scrolls to get to equivalent 1600x1200 content. • High-Res reduces Printing • High-Res reduces On-line Waits
Adding it Up… Input Fields for Energy Cost Calculator -- Based on inputs from Dell Computer
Energy Cost Calculator Outputs Note: Other Calculators on the Web: NEC/Mitsubishi: www.necmitsubishi.com/markets-solutions/index.cfm IBM: www.pc.ibm.com/us/accessories/access_promo/flatpanel/tour/savings.html
Energy Savings Calculator -- Notes • Improved Productivity associated with TFT LCDs can be accounted for by reducing the amount of time the TFT LCD will be on during each day. • Differences in climate/seasons can be accounted for by altering the number of hours per day and/or the number of weeks per year that the air conditioning is active. • The cost of energy differs by season, by region. The $0.1100 cost indicated here is rather low on a worldwide basis. • The cost of office space varies widely from city to city, from country to country. $20.00/sq ft is very low, especially for cities like New York or Tokyo, but at the same time, the benefits of shifting to smaller footprint TFT LCD monitors will take time to actually impact office layouts.
Conclusions • There is definitely a substantial energy savings favoring LCDs over CRTs. • Over the life of the products, the Total Cost of Ownership favors LCDs over CRTs. • There is a marketable advantage for companies to favor sales of LCDs over CRTs, both due to simple economic and to environmental factors. • Posting a Dell-specific Energy savings Cost-of-Ownership calculator that is highly prominent on Dell’s websites and promotional literature should help buyers make decisions to buy TFT LCD Monitors rather than CRT Monitors.