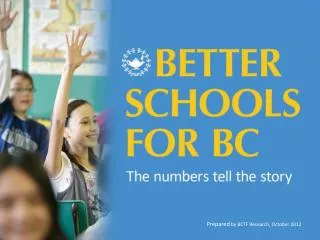
Advancing BC Education: Funding Challenges and Improvement Strategies
130 likes | 226 Vues
This report highlights how BC lags in K-12 funding compared to the national average, resulting in a low student-educator ratio and decreased specialist teachers. It proposes strategies to enhance public education quality in BC for a better future.

Advancing BC Education: Funding Challenges and Improvement Strategies
E N D
Presentation Transcript
BC falls behind in K–12 funding as a % of GDP Source: Statistics Canada (2010), Summary of Public School Indicators for the Provinces and Territories, 2002–03 to 2008–09, p. 37 and Statistics Canada, Summary of Public School Indicators for the Provinces and Territories, 2005–06 to 2009–10, (2011), p. 46.
BC falls behind Canada in per-student funding Amount BC per student funding is below the national average *As measured by the amount of Operating Expenditures per student (current dollars) Source: BCTF calculations with data from Statistics Canada. (2011), Summary of Public School Indicators for the Provinces and Territories, 2005–06 to 2009–10, p. 36.
Most provinces hired more educators BCTF calculations. Data from Statistics Canada (2011), Summary of Public School Indicators for the Provinces and Territories, 2005–06 to 2009–10, p. 25
BC has worst student-educator ratio in Canada Source: Statistics Canada (2010), Summary of Public School Indicators for the Provinces and Territories, 2001–02 to 2007–08, p. 34 and Statistics Canada (2011), Summary of Public School Indicators for the Provinces and Territories, 2005–06 to 2009–10, p. 27.
What if BC’s SER* was up to the national average? If BC brought its student-educator ratio up to the national average, we would have: • 5,800 more teachersto work with students in BC classrooms • $500 million morein the education budget • three to four additional teachers per school. *The student-educator ratio includes teachers and administrators.
Loss of specialist teachers since 2001–02 Sources: BCTF Research table, with figures from BC Ministry of Education (2002, 2008, 2012), Staff by Year and Program Code (unpublished Form 1530 data).
Increase in classes with four or more designated studentswith special needs Figures from BC Ministry of Education (various years). Overview of Class Size and Composition in BC Schools.
BC is behind on eight key measures BC’s rank among provinces—percentage change in education funding: Statistics Canada indicators, 2005–06 to 2009–10 Source: BCTF Research table with information from Statistics Canada (2011). Summary Public School Indicators for Canada, the Provinces and Territories, 2005/2006 to 2009/2010, Charts A.17.2, A.19.2, A.20.1.2, A.20.2.2, A.26.1.2, A.26.2.2, A31.2, A.32.2.
How to create Better Schools for BC Here’s our plan for quality public education: • Class-size and composition guarantees • Specialist teachersin every school • Increased investmentin public education
How to create Better Schools for BC continued • A child poverty reduction plan • Authentic student assessment • Respect for diversity and equal opportunities for all • Full collective bargaining rights