Mining Biomedical Data
Mining Biomedical Data. Vipin Kumar University of Minnesota kumar@cs.umn.edu www.cs.umn.edu/~kumar. Mining Biomedical Data. Recent technological advances are helping to generate large amounts of clinical and genomic data Biological data sets Gene & protein sequences; Microarray data;


Mining Biomedical Data
E N D
Presentation Transcript
Mining Biomedical Data Vipin Kumar University of Minnesota kumar@cs.umn.edu www.cs.umn.edu/~kumar
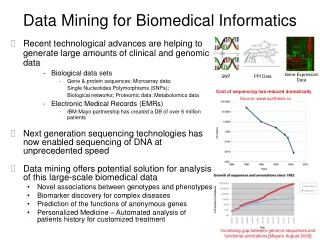
Mining Biomedical Data • Recent technological advances are helping to generate large amounts of clinical and genomic data • Biological data sets • Gene & protein sequences; Microarray data; • Single Nucleotides Polymorphisms (SNPs); • Biological networks; Proteomic data; Metabolomics data • Electronic Medical Records (EMRs) • IBM-Mayo partnership has created a DB of over 6 million patients • Data mining offers potential solution for analysis of this large-scale biomedical data • Novel associations between genotypes and phenotypes • Biomarker discovery for complex diseases • Prediction of the functions of anonymous genes • Personalized Medicine – Automated analysis of patients history for customized treatment Gene Expression Data SNP PPI Data Cost of sequencing has reduced dramatically Source: www.synthesis.cc Increasing gap between genome sequences and functional annotations [Meyers August 2006]
Challenges in Analyzing Biomedical Data • High dimensionality in the number of attributes (genes, SNPs) and relatively low sample size • Difficult to find statistically significant results • e.g., associations between gene(s) and disease phenotype • Heterogeneous data • Structured and unstructured data elements, different types of data attributes • e.g, gene expression data, networks and pathways, lab tests and pathology reports • Data is noisy, error-prone and has missing values • Difficult to discover true structure due to poor data quality • Different biological data types provide complimentary but limited information • Need to develop approaches that integrates multiple data sets
Case studies • Discovering novel associations among SNPs and disease phenotypes • Addressing issue of high dimensionality • Subspace differential co-expression analysis for discovering disease subtypes • Addressing the issue of high dimensionality and genetic heterogeneity
Application : SNP Association Study • Given: A patient data set that has genetic variations (SNPs) and their associated Phenotype (Disease). • Objective: Finding a combination of genetic characteristics that best defines the phenotype under study. Genetic Variation in Patients (SNPs) as Binary Matrix and Survival/Disease (Yes/No) as Class Label. Genetic Variation in Patients (SNPs) as Binary Matrix and Survival/Disease (Yes/No) as Class Label. Genetic Variation in Patients (SNPs) as Binary Matrix and Survival/Disease (Yes/No) as Class Label.
SNP (Single nucleotide polymorphism) • Definition of SNP (wikipedia) • A SNP is defined as a single base change in a DNA sequence that occurs in a significant proportion (more than 1 percent) of a large population • How many SNPs in Human genome? • 10,000,000 Each SNP has 3 values ( GG / GT / TT ) ( mm / Mm/ MM) Individual 1 A G C G T G A T C G A G G C T A Individual 2 A G C G T G A T C G A G G C T A Individual 3 A G C G T G A G C G A G G C T A Individual 4 A G C G T G A T C G A G G C T A Individual 5 A G C G T G A TC G A G G C T A SNP
Why is SNPs interesting? • In human beings, 99.9 percent bases are same. • Remaining 0.1 percent makes a person unique. • Different attributes / characteristics / traits • how a person looks, • diseases a person develops. • These variations can be: • Harmless (change in phenotype) • Harmful (diabetes, cancer, heart disease, Huntington's disease, and hemophilia ) • Latent (variations found in coding and regulatory regions, are not harmful on their own, and the change in each gene only becomes apparent under certain conditions e.g. susceptibility to lung cancer)
Issues in SNP Association Study • In disease association studies number of SNPs varies from a small number (targeted study) to a million (GWA Studies) • Number of samples is usually small • Data sets may have noise or missing values. • Phenotype definition is not trivial (ex. definition of survival) • Environmental exposure, food habits etc adds more variability even among individuals defined under the same phenotype • Genetic heterogeneity among individuals for the same phenotype
Existing Analysis Methods • Univariate Analysis: single SNP tested against the phenotype for correlaton and ranked. • Feasible but doesn’t capture the existing true combinations. • Multivariate Analysis: groups of SNPs of size two or more are tested for possible association with the phenotype. • Infeasible but captures any true combinations. • These two approaches are used to identify biomarkers. • Some approaches employ classification methods like SVMs to classify cases and controls.
Case Study 1:Discovering SNP Biomarkers • Given a SNP data set of Myeloma patients, find a combination of SNPs that best predicts survival. 3404 SNPs cases • 3404 SNPs selected from various regions of the chromosome • 70 cases (Patients survived shorter than 1 year) • 73 Controls (Patients survived longer than 3 years) Controls • Complexity of the Problem: • Large number of SNPs (over a million in GWA studies) and small sample size • Complex interaction among genes may be responsible for the phenotype • Genetic heterogeneity among individuals sharing the same phenotype (due to environmental exposure, food habits, etc) adds more variability • Complex phenotype definition (eg. survival) Highest p-value, moderate odds ratio Highest odds ratio, moderate p value Moderate odds ratio, moderate p value
Odds ratio • Odds ratio is defined as the following • Measures whether two groups have the same odds of an event. • Log odds ratio is often used • Odds ratio is invariant to row and column scaling
P-value • P-value • Statistical terminology for a probability value • Is the probability that the we get an odds ratio as extreme as the one we got by random chance • Computed by using the chi-square statistic or Fisher’s exact test • Chi-square statistic is not valid if the number of entries in a cell of the contingency table is small • p-value = 1 – hygecdf( a – 1, a+b+c+d, a+c, a+b ) if we are testing value is higher than expected by random chance using Fisher’s exact test • A statistical test to determine if there are nonrandom associations between two categorical variables. • P-values are often expressed in terms of the negative log of p-value, e.g., -log10(0.005) = 2.3
Example: High pvalue, moderate odds ratio Odds ratio = (a*d)/(b*c) = (40 * 54) / (30 * 19) = 3.64 P-value = 1 – hygecdf( a – 1, a+b+c+d, a+c, a+b ) = 1 – hygecdf( 39, 143, 59, 70 ) log10(0.0243) = 3.85
Example … Odds ratio = (a*d)/(b*c) = (7 * 72) / (63* 1) = 8 P-value = 1 – hygecdf( a – 1, a+b+c+d, a+c, a+b ) = 1 – hygecdf( 6, 143, 8, 70) log10(pvalue) = 1.91
Case Study 1: Issues with Traditional Methods • Each SNP is tested and ranked individually • Individual SNP associations with true phenotype are not distinguishable from random permutation of phenotype Top ranked SNP: -log10P-value = 3.8; Odds Ratio = 3.7 Van Ness et al 2009 However, most reported associations are not robust: of the 166 putative associations which have been studied three or more times, only 6 have been consistently replicated.
Evaluating the Utility of Univariate Rankings for Myeloma Data Leave-one-out Cross validation with SVM Leave-one-out Cross validation With SVM Feature Selection Feature Selection Biased Evaluation Clean Evaluation
Random Permutation test • 10,000 random permutations of real phenotype generated. • For each one, Leave-one-out cross validation using SVM. • Accuracy larger than 65% are highly significant. (p-value is < 10-4)
Case Study 2: Differential expression Differential coexpression • Differential Expression (DE) • Traditional analysis targets the changes ofexpression level cases controls Expression level Expression over samples in controls and cases [Golub et al., 1999], [Pan 2002], [Cui and Churchill, 2003] etc.
Differential Coexpression (DC) Targets changes of the coherence of expression Differential Coexpression (DC) controls cases controls cases Question: Is this gene interesting, i.e. associated w/ the phenotype? Answer:No, in term of differential expression (DE). However, what if there are another two genes ……? genes Matrix of expression values Yes! Expression over samples in controls and cases [Kostka & Spang, 2005] Biological interpretations of DC: Dysregulation of pathways, mutation of transcriptional factors, etc. [Silva et al., 1995], [Li, 2002], [Kostka & Spang, 2005], [Rosemary et al., 2008], [Cho et al. 2009] etc.
Existing work on differential coexpression Pairs of genes with differential coexpression [Silva et al., 1995], [Li, 2002], [Li et al., 2003], [Lai et al. 2004] Clustering based differential coexpression analysis [Ihmels et al., 2005], [Watson., 2006] Network based analysis of differential coexpression [Zhang and Horvath, 2005], [Choi et al., 2005], [Gargalovic et al. 2006], [Oldham et al. 2006], [Fuller et al., 2007], [Xu et al., 2008] Beyond pair-wise (size-k) differential coexpression [Kostka and Spang., 2004], [Prieto et al., 2006] Gene-pathway differential coexpression [Rosemary et al., 2008] Pathway-pathway differential coexpression [Cho et al., 2009] Differential Coexpression (DC)
Existing DC work is “full-space” • Full-space differential coexpression • May have limitations due to the heterogeneity of • Causes of a disease(e.g. genetic difference) • Populations affected(e.g. demographic difference) Full-space measures: e.g. correlation difference Motivation: Such subspace patterns may be missed by full-space models
Definition of Subspace Differential Coexpression Pattern A set of k genes = {g1, g2 ,…, gk} : Fraction of samples in class A, on which the k genes are coexpressed : Fraction of samples in class B, on which the k genes are coexpressed Extension to Subspace Differential Coexpression Problem: given n genes, find all the subsets of genes, s.t. SDC≥d as a measure of subspace differential coexpression Details in [Fang, Kuang, Pandey, Steinbach, Myers and Kumar, PSB 2010]
Computational Challenge Problem: given n genes, find all the subsets of genes, s.t. SDC≥d Given n genes, there are 2n candidates of SDC pattern! How to effectively handle thecombinatorial search space? Similar motivation and challenge as biclustering, but here differentialbiclustering !
Direct Mining of Differential Patterns Refined SDC measure: “direct” >> A measure M is antimonotonic if V A,B: A B M(A) >= M(B) ≈ Details in [Fang, Kuang, Pandey, Steinbach, Myers and Kumar, PSB 2010] [Fang, Pandey, Gupta, Steinbach and Kumar, IEEE TKDE 2011]
An Association-analysis Approach Refined SDC measure Disqualified A measure M is antimonotonic if V A,B: A B M(A) >= M(B) Advantages: 1) Systematic & direct 2) Completeness 3) Efficiency Prune all the supersets [ Agrawal et al. 1994]
A 10-gene Subspace DC Pattern Enriched with the TNF-α/NFkB signaling pathway (6/10 overlap with the pathway, P-value: 1.4*10-5) Suggests that the dysregulation of TNF-α/NFkB pathway may be related to lung cancer ≈ 60% ≈ 10% www. ingenuity.com: enriched Ingenuity subnetwork