Download
1 / 23
260 likes | 442 Vues
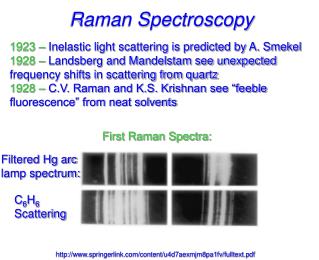
Spectroscopy FTIR RAMAN By Assistant Professor Dr. Akram Raheem Jabur. Spectroscopy “seeing the unseeable ” Using electromagnetic radiation as a probe to obtain information about atoms and molecules that are too small to see.

E N D
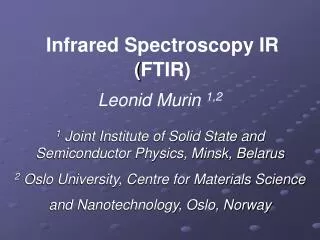
Spectroscopy FTIR RAMAN By Assistant Professor Dr. AkramRaheemJabur
Spectroscopy “seeing the unseeable” Using electromagnetic radiation as a probe to obtain information about atoms and molecules that are too small to see. Electromagnetic radiation is propagated at the speed of light through a vacuum as an oscillating wave.
electromagnetic relationships: λυ = c λ µ 1/υ E = hυ E µ υ E = hc/λ E µ 1/λ λ = wave length υ = frequency c = speed of light E = kinetic energy h = Planck’s constant λ c
Two oscillators will strongly interact when their energies are equal. E1 = E2 λ1 = λ2 υ1 = υ2 If the energies are different, they will not strongly interact! We can use electromagnetic radiation to probe atoms and molecules to find what energies they contain.
some electromagnetic radiation ranges Approx. freq. rangeApprox. wavelengths Hz (cycle/sec) meters Radio waves 104 - 1012 3x10⁴ - 3x10⁻⁴ Infrared (heat) 1011 - 3.8x10¹⁴ 3x10⁻³ - 8x10⁻⁷ Visible light 3.8x10¹⁴ - 7.5x10¹⁴ 8x10⁻⁷ - 4x10⁻⁷ Ultraviolet 7.5x10¹⁴ - 3x10¹⁷ 4x10⁻⁷ - 10-9 X rays 3x10¹⁷ - 3x10¹⁹ 10-9 - 10-11 Gamma rays > 3x10¹⁹ < 10-11
Two oscillators will strongly interact when their energies are equal. E1 = E2 λ1 = λ2 υ1 = υ2 If the energies are different, they will not strongly interact! We can use electromagnetic radiation to probe atoms and molecules to find what energies they contain.
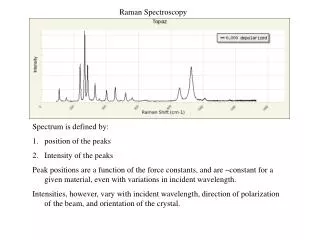
Spectroscopy λ = 2.5 to 17 μm υ = 4000 to 600 cm-1 These frequencies match the frequencies of covalent bond stretching and bending vibrations. Infrared spectroscopy can be used to find out about covalent bonds in molecules. IR is used to tell: 1. what type of bonds are present 2. some structural information
IR source è sample è prism è detector graph of % transmission vs. frequency => IR spectrum 100 %T 0 4000 3000 2000 1500 1000 500 v (cm-1)
Some characteristic infrared absorption frequencies BONDCOMPOUND TYPEFREQUENCY RANGE, cm-1 C-H alkanes 2850-2960 and 1350-1470 alkenes 3020-3080 (m) and RCH=CH2 910-920 and 990-1000 R2C=CH2 880-900 cis-RCH=CHR 675-730 (v) trans-RCH=CHR 965-975 aromatic rings 3000-3100 (m) and monosubst. 690-710 and 730-770 ortho-disubst. 735-770 meta-disubst. 690-710 and 750-810 (m) para-disubst. 810-840 (m) alkynes 3300 O-H alcohols or phenols 3200-3640 (b) C=C alkenes 1640-1680 (v) aromatic rings 1500 and 1600 (v) C≡C alkynes 2100-2260 (v) C-O primary alcohols 1050 (b) secondary alcohols 1100 (b) tertiary alcohols 1150 (b) phenols 1230 (b) alkyl ethers 1060-1150 aryl ethers 1200-1275(b) and 1020-1075 (m) all abs. strong unless marked: m, moderate; v, variable; b, broad
n-pentane 2850-2960 cm-1 sat’d C-H 3000 cm-1 1470 &1375 cm-1 CH3CH2CH2CH2CH3
IR of ALKENES =C—H bond, “unsaturated” vinyl (sp2) 3020-3080 cm-1 + 675-1000 RCH=CH2 + 910-920 & 990-1000 R2C=CH2 + 880-900 cis-RCH=CHR + 675-730 (v) trans-RCH=CHR + 965-975 C=C bond 1640-1680 cm-1 (v)
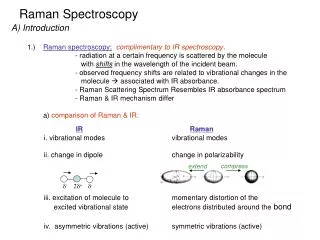
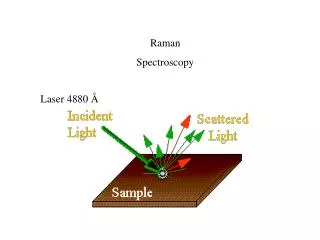
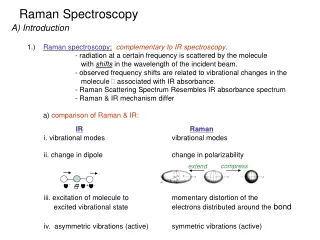
Induced Dipole Linear Molecule Emission Relaxation O C O Excitation Sample in Equilibrium Laser Excitation Relaxation Induced Dipole Emission Raman Compared to IR Dipole moments relate to IR absorption Polarizability relates to Raman scattering Polarizability how “squishy” the electron cloud is - + No electric field In the presence of an electric field H - Cl + - Uneven distribution of charge = Dipole Moment produces an induced dipole moment The Raman Effect There must be polarizability for Raman Effect to take place
0 1000 2000 3000 4000 Rayleigh Scattering • Rayleigh scattering is elastic and is indicated at zero wavenumbers • Can be a calibration aid if visible in the spectrum Low Density Polyethylene Wavenumbers (cm-1)
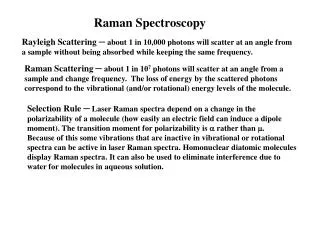
Rayleigh Scattering Stokes Shift Intensity Anti-Stokes Shift 0 300 200 100 -100 -200 -300 Raman Shift (cm-1) Stokes Anti-Stokes Raman Scattering 3 Lowest excited electronic state 2 1 0 Virtual states DE • Rayleigh scattering is elastic • Stokes and anti-Stokes scattering are inelastic • Stokes lines are more probable and therefore used most often • Anti-Stokes lines are not affected by fluorescence and occur more frequently at higher temperatures Excitation Rayleigh Scattering 3 DE Ground electronic state 2 1 0 More probable Less probable
Application Areas Pharmaceuticals Food Science • Particulate Characterization • Process Monitoring (PAT) • Authentication • Method Development • Polymorphism • Grain Studies Polymers Earth Sciences • Crystallinity • Homogeneity • Geology • Mineralogy Semiconductors • Phase Determination • Inclusion Detection Biology Medical Applications • Sensory Receptors • Cell Monitoring • Reaction Monitoring • Bacteria Characterization Forensics Consumer Products • Fibers • Paints • Questioned Documents • Controlled Substances • Building Materials • Terrorism • Particulate Contamination • Quality Control
Common Lasers Raman Instrumentation Source Sample Illumination Spectrometer • Typically laser source • Raman intensity increases as the fourth power of source frequency • Raman signal is independent of laser wavelength • Longer wavelength sources tend to cause less laser induced fluorescence High frequency = Low wavelength = Higher Raman intensity Low frequency = High wavelength = Lower Raman intensity
Raman Instrumentation Source Sample Illumination Spectrometer Confocal Set Up Detector Pinhole Aperture • Typically commercially available microscope platforms • Typically confocal configuration • Laser Spot sizes in 2-10 mm range Barrier Filter Out of Focus Light Rays In Focus Light Rays Laser Dichroic Mirror Objective Pinhole Aperture Band Pass Filter Focal Planes Sample
Raman Instrumentation Source Sample Illumination Spectrometer Widefield Set Up Detector • Typically commercially available microscope platforms • Typically confocal configuration • Laser Spot sizes in 50-500 mm range Barrier Filter Out of Focus Light Rays In Focus Light Rays Laser Dichroic Mirror Objective Pinhole Aperture Band Pass Filter Focal Planes Sample
Raman Instrumentation Source Sample Illumination Spectrometer Dispersive Spectrometer Fourier Transform Spectrometer Focusing Mirror Collimating Mirror Detector Collimating Mirror Dispersive Grating Focusing Mirror Spatial Filter Dielectric Filters Scattered Light from Sample Scattered Light from Sample Focusing Mirror Detector
Raman Instrumentation Raman Microprobe End On View of Probe Spectrometer Input Fibers Fiber Optic Cable Collection Fibers Focusing Objective Probe End On View of Collection Fibers going to Spectrometer Slit Laser Sample
Sample Preparation • Very little sample preparation needed • Solids, liquids and gasses can be analyzed • Gasses and liquids can be analyzed through a suitable container • Non-volatile liquids can be spotted onto a substrate provided slight evaporation is not critical • Samples not encompassing the entire laser spot should be placed on a suitable substrate • Aluminum is usually used as a substrate since it does not produce Raman information and does not produce fluorescence • Gold substrates can also be used • Quartz microscope slides produce a minimal amount of background fluorescence Unsuitable Receptacle Too little sample in receptacle, focal plane does not reach material Suitable Receptacle Sufficient amount of sample, focal plane reaches material
Analytical Comparison Raman vs. Infrared