Collecting and Managing Data
450 likes | 491 Vues
Learn about data collection methods, managing data complexity, and utilizing performance measurement frameworks to make informed decisions. Explore budget guidance, evaluation techniques, and program logic models to enhance data-driven actions.

Collecting and Managing Data
E N D
Presentation Transcript
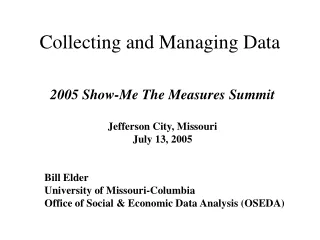
Collecting and Managing Data 2005 Show-Me The Measures Summit Jefferson City, Missouri July 13, 2005 Bill Elder University of Missouri-Columbia Office of Social & Economic Data Analysis (OSEDA)
Overview of Presentation • What are “data” and why do we care? • The focus of performance measurement • Collecting Data (types, methods, issues) • Managing Data (coping with complexity) • Discussion Selected Sources, Links and References—web links at... www.oseda.missouri.edu
Context provides meaning and relevance to data • Data • Information • Knowledge • Wisdom “The construction of knowledge involves the orderly loss of information, not its mindless accumulation.” Kenneth Boulding
How do we know we’re asking the “right” question and answering it in the “right” way? We need a contextual framework— a theory of action.
Frameworks for Performance Measures and Decisions • Basic research • Theories lead to hypotheses • Policy (applied) research • Policy frameworks focus key questions and indicator requirements
Review of some performance measurement frameworksguiding data collection choices • Budget guidance (State of Missouri) • Utilization focused evaluation (Patton) • Program logic models (Kellogg Foundation) • Balanced score card (State of Missouri OIT) • Local government (Fairfax County, Virginia)
Missouri State Budget Guidance Policy Measures of… • Effectiveness (success or impact) • Efficiency (ratio of outputs to inputs) • Clients/Individuals Served • Customer Satisfaction, if available
Utilization Focused Evaluation • Who are the decision makers • What are the decisions • Reducing the risk of making decisions There is always an implicit programmatic decision… sustain, increase or decrease support
Evaluative Decisions (eMINTs) • If the students in the high-tech classrooms score better than the other students, we will expand eMINTs. (Otherwise, we will allocate resources elsewhere.) • Because inquiry-based instruction and good tech support are critical to impact, we will monitor both and augment if needed. Source: www.oseda.missouri.edu/educational_reports/
The program logic model • The program logic model is “a picture of how your organization does its work—the theory and assumptions underlying the program.” Source: W.K. Kellogg Foundation (2004), Logic Model Development Guide, Battle Creek, Michigan.
Programs have logical (if then) relationships about which we can inquire and develop performance indicators and collect data. INPUTS OUTPUTS OUTCOMES Program investments Activities Participation Short Medium Long-term What we invest What we do Who we reach What results
Resources Activities Outputs Outcomes & Impacts Compare actual resources to anticipated Compare actual activities and participation levels Compare quality & quantity of service delivery Compare baseline indicators before and after Indicator strategies for elements of a program logic model
Stakeholders Customers Business Processes Financial Issues Learning & Growth Objectives Measures Definition Targets (rubrics) Actions Balanced Score Card
Missouri Performance Management Framework State of Missouri Office of Information Technology December, 2004 Planning Process
Missouri, OIT Data Collection Planning Process Guides • Identifying data & gathering baseline data • Determining data availability • Developing a data collection method • Questions for validating data collection Source: State of Missouri, Office of Information Technology (2004), Missouri Performance Management, Part II: Performance Management Process and Core Measures.
Define objectives Design data collection process Test the collection method Gather the data Analyze the data Use the data Refine and improve processes Data Definition Collection Process Data Sources Data Manipulation Explanatory Data Fairfax County—Data Collection for Performance Measurement Process and Documentation Steps Source: Fairfax County, Va., Department of Planning and Budgeting (2005), Manual for Data Collection for Performance Measurement.
So, there are many types of performance measurement frameworks • Budget guidance (State of Missouri) • Utilization focused evaluation (Patton) • Program logic models (Kellogg Foundation) • Balanced score card (State of Missouri OIT) • Local government (Fairfax County, Virginia)
Asking the right question in the right way:many alternative frameworks The point is that the meaning, usefulness and cost effectiveness of indicators depends on the indicator’s connection to decisions implicit in the conceptual framework adopted by the program. Disconnected data are not really “indicators” and rarely become “information” or “knowledge.”
Asking the right question in the right way:many alternative frameworks The challenge is not to merely capture data, but to use “information” to manage for results. Because data collection is often expensive, it is wise to be “connected.” Good performance frameworks include planning guides to help accomplish this essential task (see links).
Dimensions of Data Collection • Types of Data • Data Collection Issues • Data Collection Strategies • Data Collection Methods
Types of Data • Quantitative (counts, rates, means, closed-ended questions) • “hard” • Requires adequate statistical treatment • Require clear context for interpretation • Qualitative (focus groups, case studies, open-ended questions) • “soft” • Requires interpretation • Can be powerful or perceived as self-serving
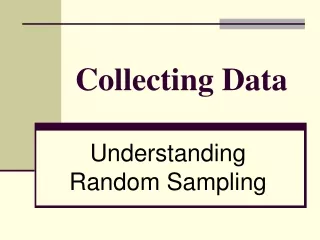
Data Collection Issues • Validity and Reliability • Reproducible—transparent—public • Consistent—accurate—precise • Number of Cases • Timeliness and Frequency of Measurement • Lagging indicators • Infrequent sources (U.S. Census)
Data Collection Issues • Representative Measures • Selection bias – (intended or otherwise) • Types of sampling (cluster, stratified) • Confidentiality (HIPAA/IRB) • Historical and future availability (trends) • Disaggregation categories (NCLB) • Security (encryption, personnel, servers)
Data Collection Strategies • Quality Assurance • Field control—training • Pilot testing • Ongoing Monitoring • Documentation • Units of Analysis (smallest appropriate) • Data linkage (merging) • IDS and Confidentiality – extract files (without ids) • Careful about size of files (data handling – transfers)
Data Collection Strategies • Proxy Measures • “Proxy measures of health care status” • “Mothers’ level of education” • “repeat clients”—”customer satisfaction” • Collaborations • Sharing existing data files • Bundling effort (teams, samples, infrastructure) • MOUs • Stratified Sampling (categories of interest)
Data Collection Methods • Existing Data • Secondary Data Sources • (Census, MCDC, MICA, MERIC, OSEDA) • Agency Files and Records (Access) • New Data Collection (adjusting practices) • Clear planning (roles and responsibilities) • Direct Costs • Impact on Business Practices • Personnel • Impact on Transaction files
Data Collection Methods • Existing Data • Secondary Data Sources • (Census, MCDC, MICA, MERIC, OSEDA) • Agency Files and Records (Access) • New Data Collection (adjusting practices) • Clear planning (roles and responsibilities) • Direct Costs • Impact on Business Practices • Personnel • Impact on Transaction files
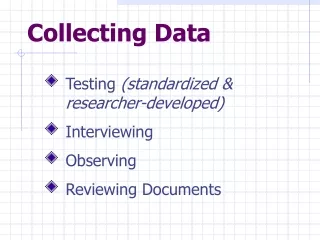
Data Collection Methods • Sample Surveys • Interviews (direct and phone) • Questionnaires (differential response rates) • Direct Observation (protocols) • Design issues • Instrument construction • Sampling • Statistical Analysis and reporting • Web Applications (Simple—Complex)
Data Collection Methods • Qualitative Methods • Focus Groups • Case Studies • Open Ended Interviews • Design issues • “Emergent Issues” • Time frames • Representativeness • Analysis and reporting
Managing Data • “Only” 52 million Google hits on topic • Scale, Complexity and Change • The World is Flat (Thomas Friedman) • The global integration of computing and communication technologies via the WEB with business practices…including performance measurement • For example: SIF” -- School's Interoperability Framework –XML
Coping with Complexity • Build as simple a plan as possible—determine what you really need & stick to it • Plan all the way through analysis & reporting • Build a capable team to work your plan • Consider both internal and external talent • Adopt an appropriate approach • e.g. Kellogg, Missouri Project Management, Balanced Score Card.
Selected Davidson’s Principles • Back it up --- Do it now! • You can’t analyze what you don’t measure. • Take control of the structure and flow of your data—save a copy of the original data. • Change awareness—keep a record of data changes and manipulations (diagrams help). • Implausibility—always check for outliers. Source: Davidson, Fred, (1996) Principals of Statistical Data Handling, Sage Publications, Thousand Oaks, Ca.
Helpful Data Management Tools • Database management systems • Pick up trucks (Access) and dump trucks (SQL) • Design, Design and Design (Architecture) • Statistical analysis systems (SAS, SPSS) • Spreadsheets -- Graphics • Geographic Information Systems (GIS) • Web applications • “dynamic” On-line analytical processing (OLAP) • “dynamic looking” -- Menu guided pages with tables and charts (gif) images
Data Collection Public Resources • Universities • Truman School – affiliated centers • Extension – OSEDA • State agencies, including.. • MERIC (DED) • Missouri Information for Community Assessment (MICA) (DHSS) • MCDC – Missouri Census Data Center
Collecting and Managing Data 2005 Show-Me The Measures Summit Jefferson City, Missouri July 13, 2005 Bill Elder University of Missouri-Columbia Office of Social & Economic Data Analysis (OSEDA)
Source: State of Missouri, Office of Information Technology (2004), Missouri Performance Management, Part II: Performance Management Process and Core Measures.
Source: State of Missouri, Office of Information Technology (2004), Missouri Performance Management, Part II: Performance Management Process and Core Measures.
Source: State of Missouri, Office of Information Technology (2004), Missouri Performance Management, Part II: Performance Management Process and Core Measures.
Source: State of Missouri, Office of Information Technology (2004), Missouri Performance Management, Part II: Performance Management Process and Core Measures.