Download
1 / 41
410 likes | 590 Vues
Observing System Monitoring Center (OSMC). Status Update April 2005 Steve Hankin – PMEL (co-PI) Kevin Kern – NDBC (co-PI). … to provide a system view of global ocean climate observations. A partnership …. PMEL User interface logic & tools NDBC Data assembly & operations

E N D
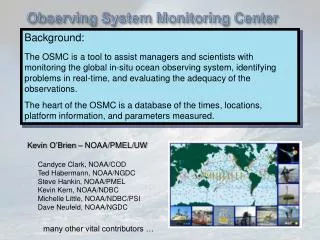
Observing System Monitoring Center (OSMC) Status Update April 2005 Steve Hankin – PMEL (co-PI) Kevin Kern – NDBC (co-PI)
… to provide a system view of global ocean climate observations
A partnership … • PMELUser interface logic & tools • NDBCData assembly & operations & assistance from Todd Pearce (OCO)User interface layout
OSMC (meta)database What is the “climate data record”? • Current (meta)data (“realtime”) • GTS -- primary source • Historical (meta)data • poorly integrated • need “DMAC” integration • for now … use a GTS archive(misses e.g. NOAA research cruises)
OSMC (meta)database at NDBC • Met and Ocean surface data are updated daily with GODAE “T-files”(06, 12, 18, 24) from the previous day ~350 MB of data per day URL=http://usgodae2.fnmoc.navy.mil/ftp/outgoing/fnmoc/data/met/2005031706.tar.Z • Updates applied to NDBC-hosted time series metadata from NDBC system • Ship call sign info from the WMO Pub 47
OSMC (meta)database at NDBC • Profiling float data from US GODAE Server • Float updates from JCOMMOPS URL = ftp://ftp.jcommops.org/Argo/Status/status.txt • Country information is assigned based on WMO allocation table URL = http://www.wmo.ch/web/aom/marprog/Operational-Information/buoy-ids.htm
OSMC (meta)database at NDBC • Met and surface ocean database back to June ‘04 • Profile data back to January ‘04
OSMC Database – Entity Diagram Country is based on ISO 3166, which defines unique 2-character identifiers for each country Organization identifies an agency, institute, university, or private company that owns or operates a reporting platform Platform identifies a ship, drifting buoy, moored buoy station, or other platform that reports marine data Observation records the instance of a marine observation for a reporting date and time.
OSMC Database Environment • Dell PowerEdge 2650 • Dual Processor 3.06 GHz/1MB Cache • Five 146 GB Harddrive • Red Hat Enterprise Linux ES v3 • Oracle Database
OSMC (meta)database • Gridded filesObservation metadata are summarized into 1X1 degree gridded files (netCDF) to support evaluation operations
OSMC must provide: • Overview (where are the obs?) • Drill-down (what are the obs?) • Evaluation (are the obs adequate?)
User interface & tools for evaluation Web-accessible to the community
Visualization & evaluationOverview all platforms reporting today
Visualization & evaluationOverview all platforms reporting air temp. today
Visualization & evaluationOverview all platforms reporting SST today
Visualization & evaluationOverview all platforms reporting SST today colored by age
Visualization & evaluationOverview Drifters reporting SST today
Visualization & evaluationOverview U.S. drifters reporting SST today
Visualization & evaluationOverview U.S. drifters reporting SST this week
Visualization & evaluationOverview U.S. Pacific drifters reporting SST this week U.S. Pacific drifters reporting SST this month
Visualization & evaluationDrill Down mouse click for metadata summary
Visualization & evaluationDrill Down mouse click to view data
Visualization & evaluationDrill Down mouse click to view plot
User interface & tools for evaluation • Overview (where are the obs?) • Drill-down (what are the obs?) • Evaluation(adequacy of the observations)
Visualization & evaluation Number of platforms per 1x1 degree box reporting SST today
Visualization & evaluation Number of platforms per 1x1 degree box reporting SST this week
Visualization & evaluation Number of platforms per 1x1 degree box reporting SST this month
Visualization & evaluation Number of platforms per 5x5 degree box reporting SSTthis month
Visualization & evaluation 5x5 degree boxes this month that had one or more SST obs every day
Visualization & evaluation Percentage of days when a 5x5 degree box had at least 5 SST obs
Visualization & evaluation Click for time series record of SST obs in a single 5x5 grid cell
Visualization & evaluation Click for time series record of SST obs inof an ocean basin
Visualization & evaluation Click for global time series of SST obs
OSMC LAS The OSMC doesn’t look like a Live Access Server …but it is (Shown is the more traditional LAS user interface)
“Adopt-a-Drifter” is another specialized user interface to the same OSMC server
Next steps • Wire it together robustly(It is not as mature as it appears) • Improve performance • User interface make-over(w/Todd Pearce) • Full support for profile data • Bring NGDC/NOSA GIS efforts into the partnership
Next steps (database) • Improve Meta-data quantity and quality • Eliminate “Not Defined” platforms • Further coordinate with JCOMM OPS • Add organization URLs • Expand data sources • Carbon Data • NOAA High Resolution Ship Data (FSU) • Repeat Lines, Ocean Reference Stations, …
and after that … • Other types of data(biochem, fisheries, …) • IOOS/DMAC integration(satellites, models, GIS, …) • Quality control metadata • Expanded evaluation metrics to be guided by community input …