Understanding PCR Score Presentation and Disease Activity Evaluation
This article outlines how the PCR score is derived using a quadro-topo algorithm based on the expression levels of 51 specific genes. A score greater than 2 is considered indicative of NET. The disease index, calculated from gene expression, is visually represented on a 2D graph. Scores are classified into low (0-55%), moderate (55-75%), and high (>75%) disease activity. Additionally, it discusses potential outcomes from test results, including baseline levels and variations across multiple tests, providing insights into disease progression.

Understanding PCR Score Presentation and Disease Activity Evaluation
E N D
Presentation Transcript
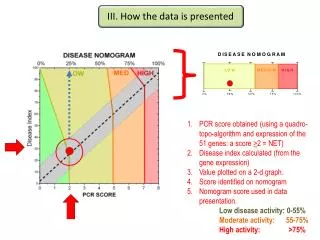
III. How the data is presented PCR score obtained (using a quadro-topo-algorithm and expression of the 51 genes: a score >2 = NET) Disease index calculated (from the gene expression) Value plotted on a 2-d graph. Score identified on nomogram Nomogram score used in data presentation. Low disease activity: 0-55% Moderate activity: 55-75% High activity: >75%
III. Your Test Results Possibilities: Test 1- base line level 3 1 Test2: level decrease 2 Test 3: level increase