Download
1 / 18
180 likes | 319 Vues
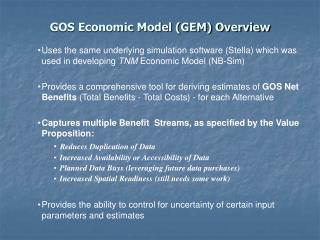
GOS Economic Model (GEM) Overview. Uses the same underlying simulation software (Stella) which was used in developing TNM Economic Model (NB-Sim) Provides a comprehensive tool for deriving estimates of GOS Net Benefits (Total Benefits - Total Costs) - for each Alternative

E N D
GOS Economic Model (GEM) Overview • Uses the same underlying simulation software (Stella) which was used in developing TNM Economic Model (NB-Sim) • Provides a comprehensive tool for deriving estimates of GOS Net Benefits (Total Benefits - Total Costs) - for each Alternative • Captures multiple Benefit Streams, as specified by the Value Proposition: • Reduces Duplication of Data • Increased Availability or Accessibility of Data • Planned Data Buys (leveraging future data purchases) • Increased Spatial Readiness (still needs some work) • Provides the ability to control for uncertainty of certain input parameters and estimates
Net Benefit Calculation/Estimation Process • GEM uses a variety of inputs (i.e., quantitative estimates) to determine the Total Annuals Benefits associated with GOS • The design of the model’s benefit elements is based largely upon the type of GOS benefits documented in the GOS Value Proposition • The Cost portion of the model is based upon input from the GOS LCC Analysis • Major runs of the model will coincide with key FY 2004 GOS Milestones - Submission of the BY’06 Exhibit 300 (September 2004)
Measuring Spatial Readiness/Spatial Intelligence • The Value Proposition defines certain key Premises: • - GOS plays a major role in closing the GAP that exists in federal agencies in terms of Spatial Readiness • - Spatial Readiness is the essential prerequisite for having Spatial Intelligence • - Applying Spatial Intelligence leads to better (more informed) decision making and better use of agency resources • GOS overall benefits cannot be fully realized until the overall Federal Agency GAP has been closed • Therefore, GOS’ role in accelerating GAP Closure is the basis in which the federal enterprise achieves Spatial Readiness
Federal Agency Assessment(Measuring Spatial Readiness) • Spatial Readiness is one of several key parameters and estimates which serve as inputs to the overall Exhibit 300 Cost Benefit Analysis Preparation • The GOS team’s baseline approach to the Life Cycle Cost (LCC) Analysis and CBA is based upon grouping Federal Agencies and Departments into Tiers • The proposed next step is to follow this initial grouping with a more rigorous approach which takes into account specific criteria for assessing Spatial Readiness • The proposed approach consists of the following steps: • - Form a small inter-agency assessment team • - Enable team to score agencies independently based upon a specific set of criteria • - Total team member scores and develop readiness index for each agency
Assumption: Having a large Investment in Geospatial Technology (as a % of an Agency’s IT Infrastructure) means high degree of Spatial Intelligence) High (Uses Spatial Intelligence) Representative Agencies’ Distribution for Tier 3 Essential (On-going Use of Spatial Data) Overall Readiness GAP Spatial Readiness Low (Required for GOS Compliance) Smaller Readiness Gap Inadequate (inability to use spatial data) Agency X Tier 1 Tier 2 Tier 3 Top Down Approach forAssessing Spatial Readiness **Current Readiness - recommend that a small inter-agency team assess and rate each Tier 2 and Tier 3 agency based upon certain GOS specified criteria (i.e., Readiness Matrix)
Top Down Approach for Measuring Spatial Readiness Representative Readiness Assessment Criteria Assessment and Scoring of individual Agencies/Depts. Representative Spatial Readiness Index (varies by Agency and by Tier) Representative GAP Size (varies by Agency and by Tier) Note: Spatial Readiness Assessment should also distinguish “Early Adopters” from “Late Adopters” (as defined in the Urban Logic Value Proposition Report)
Measures Direct Impact on Federal Sector Primarily Through Improvements in Efficiency (Spatial Readiness) and Operations (Spatial Intelligence) GEM Benefit Estimation Measures Primarily Impact on State and Local Governments Through increasing GIS Application Usage (and data access) Provides Indirect measurement only - below the Federal Level GEM Comparison to TNM Economic Model (NB-SIM) • GEM provides an estimate of GOS Net Benefits focused Primarily at the Federal Level • Benefits to State and Local government levels are inherent in the Value Proposition by mapping to the BRM Federal Sector GOS Economic Model Boundary where benefits should accrue to both TNM Economic Model • NB-SIM provides an estimate of TNM Net Benefits focused Primarily at the State and Local Level (i.e., 3,078 counties) • Apps Usage at the Federal level can also be measured directly using NB-SIM - but that is not the focus of benefits associated with TNM State and Local Governments
Comparison to TNM Economic Model - Cont’d • Benefit estimates for measuring Spatial Intelligence (i.e., going from theory to practice) requires more analytical work • GEM is focused on measuring Net Benefits for all Agencies across the Federal Sector. Correspondingly, the model and inputs could be tailored for individual agencies to assess: • - Their internal CBA for geospatial investments • Their contribution to the overall GOS CBA • GOS Benefits should also accrue directly to States and local governments through their partnership with GOS and improvements in discovery and better access to spatial data • Apportionment of GOS Benefit Estimates to State and local levels would require a special study (i.e., a tailored run of GEM for a subset of agencies and BRM sub-functions)
Comparison to TNM Economic Model - Cont’d • TNM Economic Model was designed to do the following: • - simulate the number of users (across all US counties) • - estimate the extent of [gis] application innovation and diffusion • estimate the changes in net benefits (NB) of implementing spatial data applications • TNM Economic Model sought to measure the impact (NB) of there being a National Map versus an environment in which there is no National Map.
Comparison to TNM Economic Model - Cont’d • TNM Economic Model Benefits: • - Value of TNM Data in helping to reduce the costs to generate, populate, or operate spatial databases • Value of improving the outcome of projects because of better information • TNM Economic Model defined 3 Tiers of Applications: • - Tier 1 (5% of all counties) - represents sophisticated GIS applications (e.g., complex geospatial statistics and formal optimization modeling) • - Tier 2 (30% of al counties) - represents applications which use digital spatial data to perform functions such as complex route planning or locational analysis • - Tier 3 (65% of all counties) - represent basic applications, including paper mapping and simple overlay analysis in a GIS
The GEM Visual Representation(A Brief Synopsis) The Stella Modeling Tool provides a visual representation of mathematical concepts, formulas, and equations. These equations are used to run the economic simulation that has been developed for GOS. The GEM Visual Representation is a system diagram which shows stocks (where things accumulate, such as benefits and costs). There are also flows into and out of the stocks, which are represented by lines (or pipes). There are also varying rates of flow (or change) through these pipes - such as rates for increasing benefits over time.
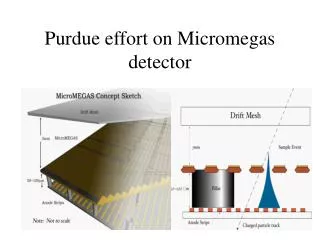
GEM Model Visual Components – Federal Budget Input This portion of GEM shows how budget information is represented in the model. This information is later tied to the Federal agencies BRM sub-functions.
GEM Model Visual Components - Spatial Readiness This portion of GEM shows the various components of Spatial Readiness and how the Model handles the relationship between increasing Spatial Readiness (and Spatial Intelligence) as the Gap Size is decreased.
GEM Model Visual Components - Benefit Estimation This portion of GEM shows the key Benefit components that are based upon improvements in federal agency efficiency and coordination, through GOS. It also provides for increasing benefits based upon improvements to agencies BRM sub-function.
GEM Model Visual Components - Cost Elements This portion of GEM shows the various GOS Cost components and how costs are accumulated on an annual basis. The accumulation of costs leads to increase in GOS Percent Completion. This increased completion is, in turn, tied to the rate at which benefits accumulate on an annual basis.
GEM - The Complete Picture Federal Agency Spatial/Non-Spatial Budgets GOS Benefit Estimation Spatial Readiness Estimation Life Cycle Cost Input