Lithography Variability and Its Impact on Device Electrical Performance: FLCC Year II Overview
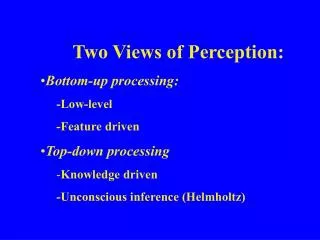
This tutorial provides an in-depth analysis of how lithography contributes to device and circuit variability, particularly focusing on factors affecting electrical performance such as threshold voltage variability. Highlighting the UC Discovery Project's Year II progress, it outlines collaborative opportunities for silicon wafer fabrication, and details the introduction of new faculty, students, and industry partners. Key tutorials will cover topics like line-edge roughness, proximity effects, and mitigation strategies through lithography-aware designs, aimed at understanding and controlling variability in semiconductor fabrication.

Lithography Variability and Its Impact on Device Electrical Performance: FLCC Year II Overview
E N D
Presentation Transcript
FLCC Feature-level Compensation & Control Q&A on Our Year II Proposal Tutorial: Lithography as a Contributor to Device/Circuit Variability, September 27, 2004 A UC Discovery Project
FLCC Year II Highlights Proposal Process on Track: • Company feedback and commitment Tu, Sept 28th • Post final proposal and companies on web F Oct 1st New Team: • New Faculty: Jane Chang, UCLA Plasma etching and feature level modeling • New Companies 17 => 20 ASML Litho Cypress CMP, Litho, Etch HGST polishing, Etch • New Students ? Polishing – Dave Dornfeld ? Device – Tsu-Jae King Tutorial: Lithography Variability
FLCC Year II: New Opportunity - Silicon Wafers Cypress has offered to collaborate in the fabrication of silicon wafers • Test structures for screening and monitoring Get feedback on existing test patterns and invent new ones • Short-loop front-end designs Develop new experiments on identifying and characterizing factors contributing to electrical variability such as variability in threshold voltage Opportunity to explore contributions of proximity effects, resist line-edge roughness, and etch pattern transfer and the role of OPC and lithography aware design to mitigate them. Tutorial: Lithography Variability
Short-Loop Front-End Layout Cut-line Device cross-section ACTV POLY <= Layer under test CON (Litho, Etch) MET Tutorial: Lithography Variability
FLCC Tutorials Tutorials and Seminars: Oct 12: Oct 26: Paper Reading Topics: Device, Diffusion Relationship of process variability to device variability Posted on web shortly Tutorial: Lithography Variability
FLCC Feature-level Compensation & Control Tutorial: Lithography as a Contributor to Device/Circuit Variability, Andy Neureuther, September 27, 2004 A UC Discovery Project
Poly Gate Shape Issues 1 2 3 1 Line end shortening and rounding 2 Ringing away from tip 3 Wiggles from nearby featues Tutorial: Lithography Variability
Poly Gate Shape Dependencies Possible image factors 1D: (Linewidth Variation) Isolated versus dense, focus, aberrations Possible image factors 2D: (Shape Variation) Line end shortening, ringing near line end, wiggles near features, focus, misalignment, aberrations Possible process factors: Imaging material response and line edge roughness (LER) Increase in roughness during pattern transfer (plasma etch) 3D gate shape and impact on spacer and implant Tutorial: Lithography Variability
Examples of 1D Effects Layout Image The outside lines are typically smaller than the inside line that has neighbors. Possible fix is pre-compensation but the amount of change needed depends on focus Tutorial: Lithography Variability
Examples of 2D Gate Length Variations Shape of Poly/ACTV overlap is no longer rectangular. Some device sub-regions in parallel have very short channel lengths The shortest channel length is a function of alignment, focus, aberrations, etc. 1 2 3 Tutorial: Lithography Variability
Line Edge Roughness Increases Variations Photoresist has inherent roughness at a length scale similar to future gate lengths (30 nm) This roughness tends to increase during the plasma etching of the gate As a result length changes of more than 10% of the gate length are expectedb 1 2 3 Tutorial: Lithography Variability
Poor Image Quality Increases LER Variations LER is known to increase with poor image quality LER will thus • increase at 2D features such as line ends (poor slope) • increase between features (light in dark area) As a result device electrical variability is expected to be both feature type and shape dependent 1 3 2 2 3 1 Tutorial: Lithography Variability
Electrical Impact of Gate Length Variation Whenever LEEF decreases beyond a critical point the threshold voltage VT drops rapidly. VT LEFF Tutorial: Lithography Variability
Low VT Gives Exponential Increase in Power Battery life limits power consumption and hence leakage current. This in turn limits the minimum value of VT and hence the minimum gate length and even the acceptable distribution of gate lengths. ISUB_LEAKAGE Limit of Battery 10X VT Tutorial: Lithography Variability
Mitigation via OPC and Litho-Aware Designs Litho-Aware Design • Put gates and contacts on a horizontal grid • Expose vertical line and space pattern with dipole illumination • Trim with a lower resolution sequential exposure • Results in very uniform gate length Downside • Throughput/alignment • Requires self aligned contact ACTV POLY <= L&S + Trim CON MET Tutorial: Lithography Variability
Test Patterns for Characterizing Variations Short-loop front end process with various gate structures The location of the Source/Drain is not critical for measuring VT or leakage ACTVh POLY <= Layer under test CON (Litho, Etch) MET Tutorial: Lithography Variability
Master Layout for Characterizing Poly Short-loop front end process with various gate structures W Tutorial: Lithography Variability
Summary • Variability in geometrical gate width and shape is produced by image degradation with aberrations, misalignment, resist development and LER. • The resulting shapes affect non-linear phenomena such as Drain Induced Barrier Lowering (DIBL) and impact ionization that in turn affect power consumption and performance. • This circuit/device variability can be reduced through layout adjustments of gate sizes and locations, Optical Proximity Correction (OPC) of existing layouts, and the use of lithography aware IC circuit design strategies based on multiple exposures. • The study of the relationship of the variability of device/circuit performance to process is key research topic in design for manufacturing (DFM). Tutorial: Lithography Variability
References • A.B. Kahng, et. al, {Examples of incorporating physical phenomena in process aware design} SPIE Vol. 5567-174 to appear. • A.P. Balasinski, “Device analysis: a way to reduce patterning cost at mask and wafer level,’ BACUS 2004, SPIE Vol. 5567-107 to appear. • C.A. Haidinyak and C.E. Tabry, “Experiments with contact SEM images,” SPIE Vol. 5567-79, to appear. • J. Wang, A.K. Wong and E.Y. Lam, “Design rule optimization for fabrication-friendly standard cells,’ BACUS 2004, SPIE Vol. 5567-13 to appear. Tutorial: Lithography Variability