PATHOGEN VARIABILITY
PATHOGEN VARIABILITY. All pathogens exist as populations of individuals, not unlike the people in this room, this city, etc. They, like people, share many common characteristics but vary greatly in many others.

PATHOGEN VARIABILITY
E N D
Presentation Transcript
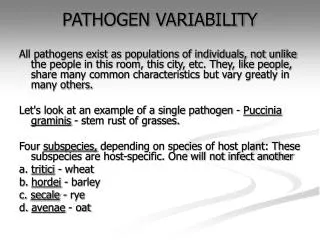
PATHOGEN VARIABILITY All pathogens exist as populations of individuals, not unlike the people in this room, this city, etc. They, like people, share many common characteristics but vary greatly in many others. Let's look at an example of a single pathogen - Puccinia graminis - stem rust of grasses. Four subspecies, depending on species of host plant: These subspecies are host-specific. One will not infect another a. tritici - wheat b. hordei - barley c. secale - rye d. avenae - oat
PATHOGEN VARIABILITY Below this level there are races (> 200 for P. graminis tritici alone!). Races are defined by ability to develop on specific host genotypes (varieties, cultivars, hybrids, etc.). Races are identified by ability to cause disease on members of a set of 10 differential varieties that contain specific resistance genes.
Races cont. From this information several things can happen: 1. Prevalent races in any given area will be identified. This will allow identification of varieties with resistance to these races, and these can be recommended for planting. 2. USDA Cereal Rust lab in St. Paul, MN keeps tracks of changing race status in US, identifying new races, etc. Within a given race, there are many biotypes.These are distinguished by the severity of disease they cause on any given host genotype. They vary in many ways, such as spore longevity and survival, lesions/leaf, spores/lesion, etc.
"Breakdown" of Resistance: This term is used when a previously resistant variety suddenly develops disease. It implies that the host has changed, that the resistance mechanisms no longer work, etc. New pathogen races have developed because of selection pressure that was put on population by the host resistance mechanism. Mechanisms of Change in Pathogen Populations; 1. Mutations - occur during mitosis; an accident in duplication of genome results in slight or severe changes. 2. Sexual recombination - fusion of two In cells > 2n > two In cells with mixed genetic info. + + n n 2n n n
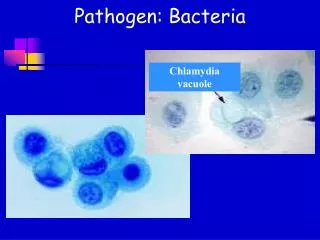
Mechanisms of Change in Pathogen Populations cont. 3. Heterokaryosis - 2 or more nuclei in same somatic cell. We've seen this commonly in smut fungi, rust fungi, etc. Traits are governed by two nuclei, which makes for much more variability. 4. Transformation (in bacteria) - cells rupture and release genetic material. Adjacent cells "absorb" this material and incorporate it. Acceptor cell is modified by new material. 5. Conjugation (in bacteria) - cells contact each other directly and exchange genetic material.
Mechanisms of Change in Pathogen Populations cont. Sectoring - one portion of fungal culture (from a single propagule) is phenotypically different. Can result from mutation, heterokaryosis, etc. Phenotype A Phenotype B Phenotype C
Monitoring Disease in Time - Disease Progress Curves Disease progress curves show the progress of a disease across time. These are important for evaluating total impact and loss by a disease, as well as determining when to initiate control measures.
Two Basic Types of DPCs • Monocyclic diseases - these are characterized by a large release of inoculum early in the season. Ex: Charcoal rot of most dicots, caused by Macrophominaphaseolina Ex: Cabbage club root, caused by Plasmodiophora brassicae Many soilborne root pathogens tend to be monocyclic.
Two Basic Types of DPCs 1. Monocyclic diseases 2. Polycyclic diseases - these are characterized by a small amount of primary inoculum but several secondary cycles to increase inoculum. Ex: Potato late blight, caused by Phytophthorainfestans Ex: Apple scab, caused by Venturia inaequalis Most diseases are polycyclic, including nearly all we discussed for Ascomycetes.
The curve appearance also depends on both pathogen and host factors. For example: 1. Initial inoculum dose can determine rate of disease increase, to a point. Extremely high doses do not necessarily result in very high disease levels. Remember - disease is limited by number of available infection courts. Disease Progress Curves
The curve appearance also depends Initial inoculum dose Host resistance can modify rate of disease increase, through any of the mechanisms we discussed earlier Disease Progress Curves
Monitoring Disease in Space - Disease Gradient Curves These measure the amount of disease as you go away from a source. These do not work for diseases such as wheat leaf or stem rust, where inoculum tends to settle in a field like a cloud and foci are uniformly distributed everywhere. They work best with discrete sources of inoculum.
Area Under Disease Progress Curve AUDPC Sometimes it is hard to distinguish Resistant from Susceptible varieties if the curves aren't as 'perfect' as the previous diagrams. Therefore we determine, the AUDPC AUDPC = Σ ( [yi + yi+1] / 2) (ti+1-ti)
Disease Progress Curve Lag phase 1/2 of crop diseased 0 25 50 75 100 Disease severity (%) Exponential growth Time (days) Note: Slide is the property of B.M. Pryor, U. Arizona
Thresholds for action • Area under the disease progress curve (AUDPC) is an important determinant for management action • Damage threshold: the point at which an increase in disease will result in an economic loss • Economic threshold: the point at which the cost of management equals the increase in yield due to management Lag phase 0 25 50 75 100 1/2 of crop diseased Disease severity (%) Exponential growth Time (days) harvest Note: Slide is the property of B.M. Pryor, U. Arizona
Comparison of disease progress curves Slope = r1 Condition A Slope = r2 disease Condition B time Slope equals disease units/time (usually expressed in days) Note: Slide is the property of B.M. Pryor, U. Arizona
Disease Forecasting These are efforts to predict the amount of disease that you will have sometime in the future. There are several important factors necessary for accurate disease forecasting: I. Pathogen factors - we've seen these before 1. Virulence 2. Quantity of primary inoculum a. This is the amount available at the beginning of the season. b. More important for mono- than for polycyclic diseases. c. It's very hard to determine the amount of secondary inoculum.
Disease Forecasting These are efforts to predict the amount of disease that you will have sometime in the future. 3. Length of reproductive cycle 4. Location of reproductive structures 5. Mode of spread
Early Work in Disease Forecasting One of the first diseases targeted was late blight of potato. In 1926, the first predictors were published: 1. > 4 hr dew at night . 2. Min temperature > 10 C 3. > 80% cloud cover the next day 4. > 1 mm rainfall in next 24 h .